Climate Change in Australia
Climate information, projections, tools and data
Australian Warming
How much has Australia warmed since pre-industrial times?
The 1.5, 2, and 3 °C global warming levels used by the National Climate Risk Assessment and for which data can be downloaded from this website refer to warming of the surface air temperature averaged over all land masses and oceans across the globe, relative to the 1850-1900 ’pre-industrial’ baseline.
No one lives in the global average, we care most about change at individual locations, especially ones we directly experience. In order to better understand what the global warming levels mean for our region, we can consider how much Australia and regions within Australia (e.g. states and territories) have warmed since the pre-industrial baseline. Some regions have warmed much more than the global average, and other areas less. Australia and all states and territories except Tasmania have warmed by slightly more than the global average (land and ocean) but much less than some places in the world.
Up to the start of the recent decade (2011-2020), Australia warmed by an estimated 1.6 °C since 1850-1900, which is around 1.4 times the global average and 0.9 times the global land average. Temperature changes for 1850-1900 to 2011-2020 by state are between 1.1 °C in Tasmania to 1.7 °C in South Australia.
| Change 1850-1900 to 2011-2020 (land only) | Ratio to warming across the globe (land and ocean) | |
|---|---|---|
| Australia | 1.6 °C | 1.4 |
| New South Wales and ACT | 1.6 °C | 1.4 |
| Northern Territory | 1.5 °C | 1.4 |
| Queensland | 1.7 °C | 1.5 |
| South Australia | 1.7 °C | 1.5 |
| Tasmania | 1.1 °C | 1.0 |
| Victoria | 1.4 °C | 1.2 |
| Western Australia | 1.5 °C | 1.4 |
The Australian land mass has warmed by around 1.8 °C between 1850-1900 and 2024.
How can we assess how much Australia has warmed?
Global context
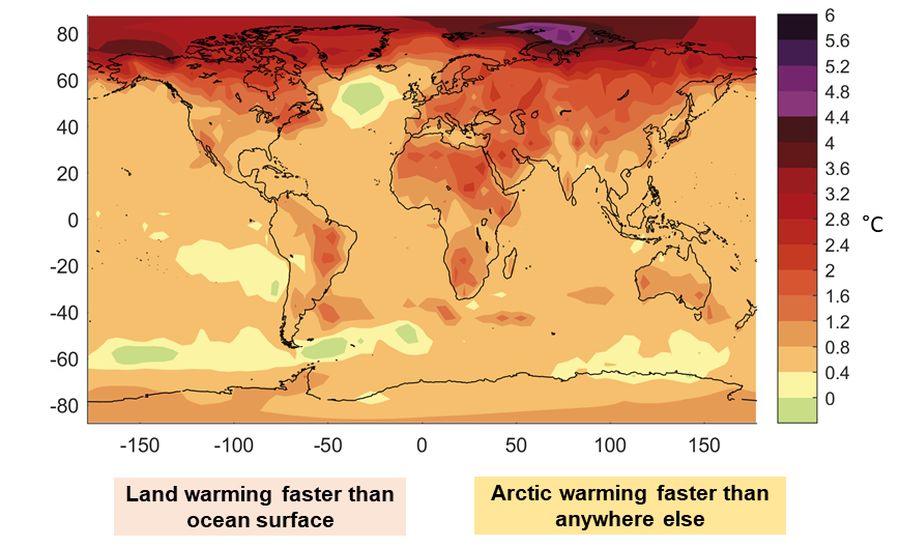
Global gridded datasets are intended to give a global perspective and broad spatial coverage at coarse spatial resolution. The global land area has warmed more than the ocean: up until the last decade (2011–2020), warming was around 1.1 °C for the globe including land and oceans and around 1.6 °C for global land mass alone.
Results are similar in all the major global datasets, the Cowtan and Way (2014)
dataset gives us complete global coverage – showing temperature change from 1850-1900 to 2011-2020:
National Climate Records
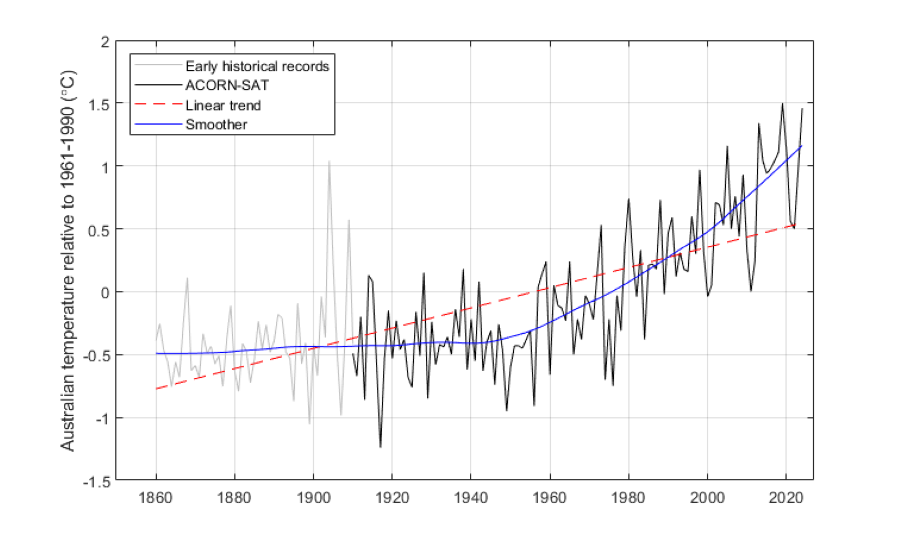
For looking in detail at Australian land temperature, the standard high-quality climate record from the Bureau of Meteorology is the Australian Climate Reference Network for Surface Air Temperature, ACORN-SAT (Trewin et al. 2020 ). The Bureau of Meteorology provide ACORN-SAT data from 1910 and calculate change in annual average temperature by fitting a straight line to the 1910–current whole year data. Shown here are the values from 1910-2023 using ACORN-SAT version 2.1 (values given below each graph).
We need to estimate temperature change from 1850–1900 to examine global warming levels. To do this, extra datasets can be brought in, and change is best measured using the difference between periods or a curved line rather than a straight line:
- Data coverage and quality is poor before 1910, so an estimate of change from the 1850–1900 baseline will be inevitably imprecise. Various methods to estimate change from this early period are possible, each with their strengths and limitations – see technical note 1 for more detail. All methods produce an estimate of change between 1850 and 1910 of between 0.0 and +0.4 °C in Australia.
- A curved line (a 41-year Lowess filter) fits the extended series we tested better than a straight line. An example here is the ACORN-SAT version 2.1 series blended with early historical records for 1860-1910 from Ashcroft et al. (2012) .
Early historical records are not available for each state and territory and some international datasets have large biases in the early period for some of these regions. Therefore, to give reliable and comparable results for every state and territory, the median change from climate models is used as the central estimate of warming between 1850–1900 and 1910–1930, and this is blended with the high-quality observations. The highest and lowest estimate from any method used (global datasets, early historical records, climate models) is presented as an uncertainty bound. See Grose et al. (2023) for more detail.
Australia warming
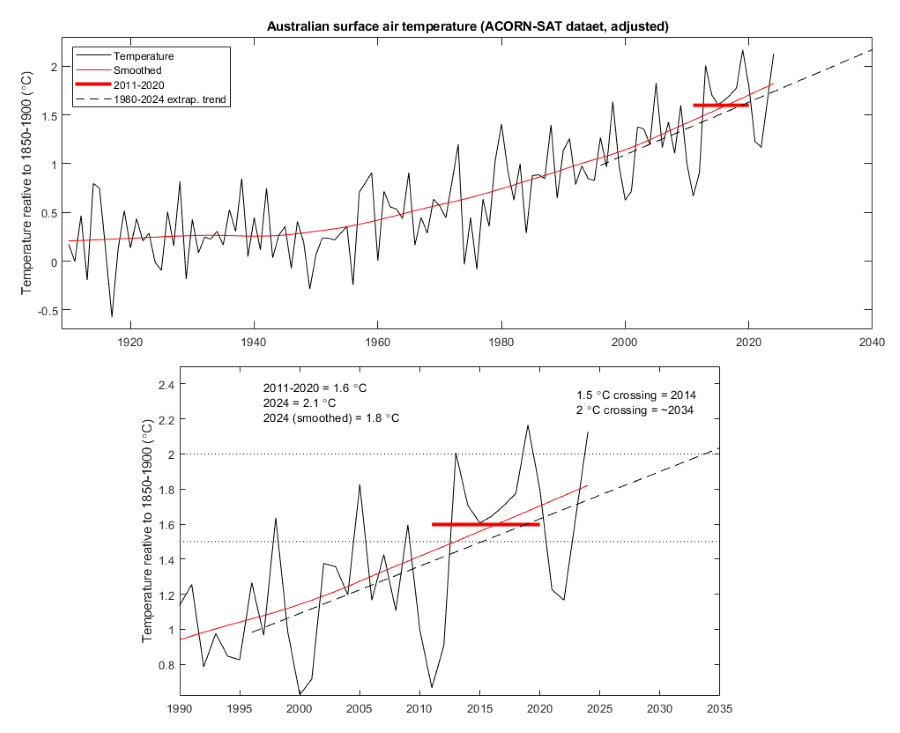
Using the methods noted above, warming of the Australian land mass can be shown by differences between various baselines since 1850 in Australian land temperature. The central estimate of the difference between the 1850–1900 period to the 1910–1930 period is 0.21 °C, and this can be added on to observed change since 1910 to give an estimate of change since the earlier baseline period (1850-1900).
Using this method, up to the recent decade (2011-2020) shows that Australia has warmed by an estimated 1.6 °C (2011-2020 minus 1850-1900), which is slightly higher but within the uncertainty range of change measured as a linear trend and around 1.4 times the global (land and ocean) average and 0.9 times the global land average.
We can estimate the warming in 2024 from the smoothed trend (~1.8 °C), and when Australia is likely to reach 2 °C warming from an extrapolation of the recent linear trend (~2034).
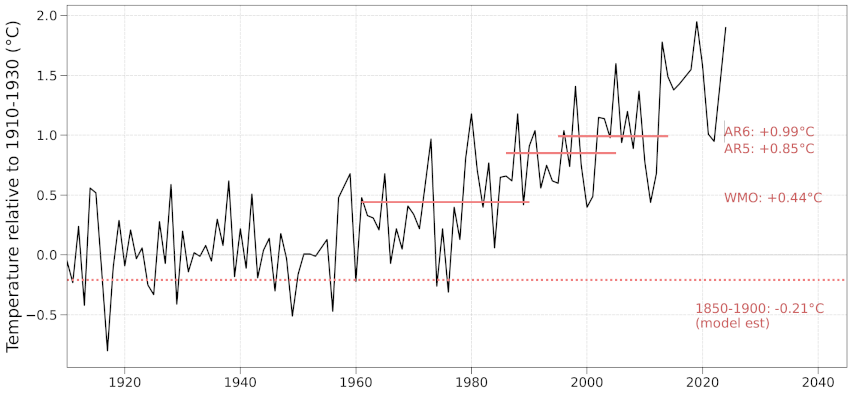
Australian mean annual temperature relative to the 1910-1930 period in the ACORN-SATv2.1 dataset, with the time periods as well as the value of the several other temperature baselines are overlaid (red lines). The periods are:
- WMO = the older World Meteorological Organisation (WMO) baseline of 1961-1990 still widely used
- AR5 = IPCC Fifth Assessment report (AR5) baseline of 1986-2005 (commonly used on this website)
- AR6 = IPCC Sixth Assessment report (AR6) baseline of 1995-2014
The estimated change between 1850-1900 and 1910-1930 (0.21 °C) can be added on to these values to give an estimate of change since the 1850-1900 baseline, e.g. 0.86 and 0.21 give +1.08 °C between 1850-1900 and 1986-2005.
Page last updated 1st Dec 2025