Climate Change in Australia
Climate information, projections, tools and data
Climate variability and climate change
Weather can be highly variable on a daily, weekly, or even yearly basis. Today might be dry with a top temperature of 22 °C. Tomorrow might be wet, with a top of 14 °C. The weather is what you experience each day.
Climate is the average weather pattern in a place over at least 30 years. Sydney’s climate is warmer than Hobart – even though occasionally, Hobart’s maximum temperature will exceed Sydney’s.
Australia’s climate is famously variable. The El Niño Southern Oscillation (ENSO), for example, has a major impact on our rainfall, with El Niño conditions occurring every three to eight years and generally resulting in below average rainfall over much of eastern Australia, while wetter than average conditions can occur during La Niña years.
Climate variability describes the way climate elements such as temperature and rainfall depart from the average value in given months, seasons, years, decades or centuries. Consecutive summers, for example, will not all be the same, with some cooler and some warmer than the long-term average.
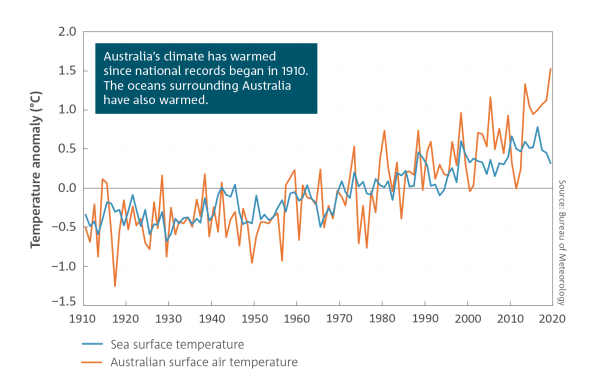
Climate is said to be stable if the long-term average does not change significantly over time. However, climate in Australia and worldwide is changing. Climate change refers to a statistically-significant trend in climate over many decades. It is superimposed on natural yearly-to-decadal climate variability. This variability can mask or enhance underlying trends.
The globally averaged surface warming is 0.85 °C from 1880 to 2012. It is very likely that the number of cold days and nights has decreased and the number of warm days and nights has increased on the global scale.
Australia’s average surface warming is 0.9 °C since 1910, due to a 0.8 °C increase in maximum temperatures and a 1.1 °C increase in minimum temperatures.
On a global scale, the ocean warming is largest near the surface, and the upper 75 m warmed by 0.11 °C per decade over the period 1971 to 2010.
Global-average sea level has risen. The rate of increase is 1.7 mm/year between 1901 and 2010, 2.0 mm/year between 1971 and 2010, and 3.2 mm/year between 1993 and 2010.
Australian-average sea level has risen 1.4 mm/year from 1966-2009 and 4.5 mm/year from 1993-2009.
Further information (external links)
State of the Climate > CSIRO and the Bureau of Meteorology Fifth Assessment Report > Intergovernmental Panel on Climate ChangePage updated 21st December 2020


