Climate Change in Australia
Climate information, projections, tools and data
Step 3.2: Analyse Future Climate Risk (unquantified)
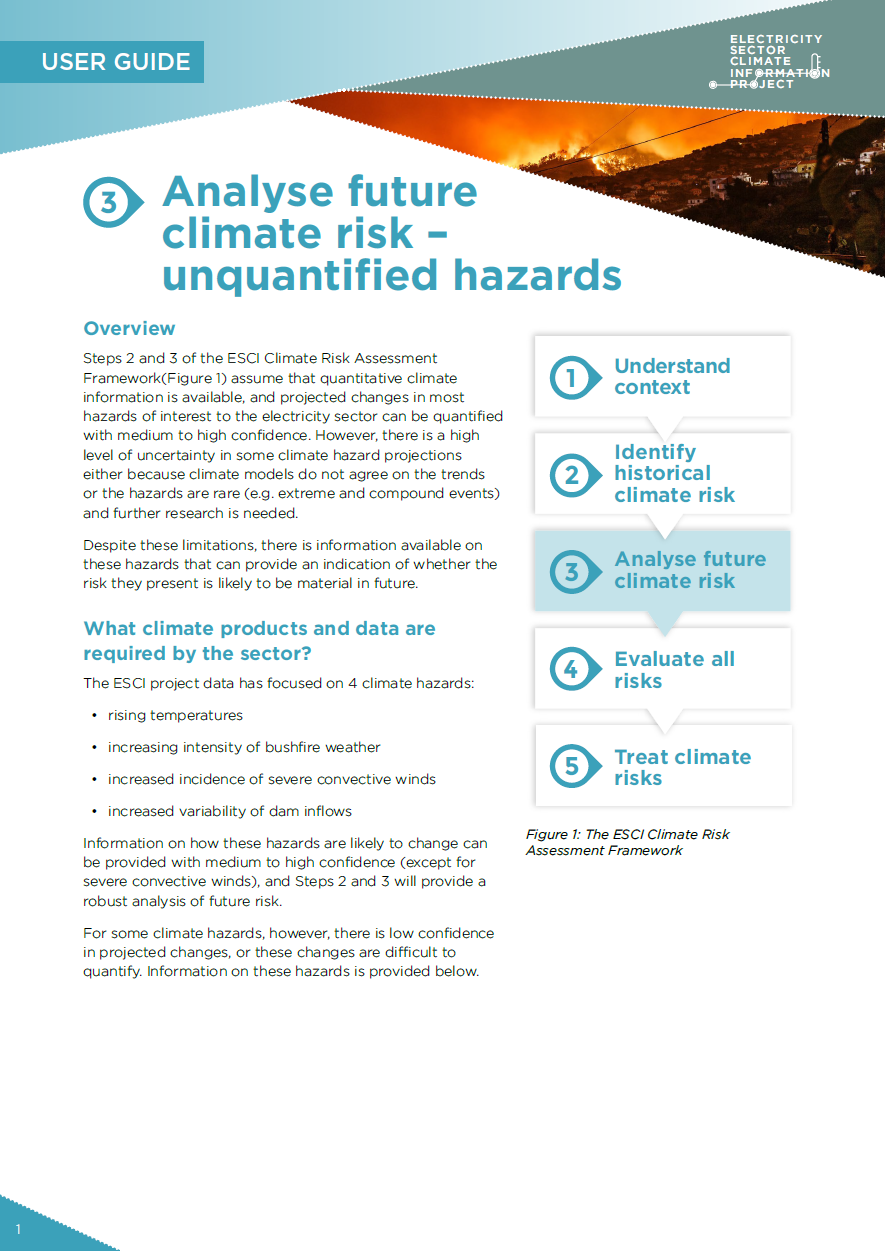
Guidance Step 3.2
(pdf 1.2 MB)
- Analysing Risks for Hazards that are Difficult to Quantify?
- Why is the Influence of Climate Change on Some Hazards Difficult to Quantify?
- Qualitative Risk Analysis
- Extreme and Compound Extreme Weather Events
- References
- Downloads
Analysing risks for hazards that are difficult to quantify
For some hazards, the projected changes can be provided with medium to high confidence, in which case using the model developed in Step 2 and integrating quantitative climate information will provide a robust analysis of future risk.
For some climate hazards, however, there is low confidence in projected changes, or these changes are difficult to quantify. Information on these hazards, and how to use this information in a risk assessment, is provided below.
WHY IS THE INFLUENCE OF CLIMATE CHANGE ON SOME HAZARDS DIFFICULT TO QUANTIFY?
Uncertainty in the influence of climate change on hazards can be due to several factors, for example, the phenomena may be rare, resulting in few observations and some physical processes are not well-understood by current science (e.g. aspects of how lightning forms). Many dangerous weather events are a result of atmospheric processes operating at scales of less than 1 km so global climate models, with a resolution of around 100–150 km, cannot represent them. Detailed evaluation of extreme weather processes, and indices constructed from these processes, may be used to provide an indication of how these hazards are likely to change in the future. For example, climate information used in the ESCI case study and technical report on severe convective winds is derived from broad-scale indices of weather phenomena.1
Extreme weather events that occur simultaneously or in close succession (e.g. fires across multiple regions, or fire followed by floods) are called compound events. The combination of extreme events that are already rare makes the probability hard to assess. In future, large ensembles of climate projections could be explored to identify classes of extreme compound events and estimate the probability of them occurring; however, this is very computationally intensive. At present, climate science can provide well-characterised examples of these events, extracted from historical data and climate projections, but in general cannot provide probability information for future compound events.
QUALITATIVE RISK ANALYSIS
The historical relationships between weather/climate and asset/system performance that were developed in Step 2 of the ESCI Climate Risk Framework are still of use for an assessment of climate risk when hazards are hard to quantify.
The information below (and cited sources) provides qualitative information, such as an indication that the risk is increasing or decreasing or that some events, such as tropical cyclones, may strike new locations. If infrastructure is already operating at or near the limit of its capacity then qualitative information may be sufficient to indicate that risk mitigation is needed. If confidence in the projection is low (e.g. tropical cyclone intensity), then sensitivity analyses can be conducted with the relationship developed in Step 2 to identify at what point an impact threshold may be crossed.
Tropical cyclones
On average, about 11 tropical cyclones form or move into the Australian region each year. The number has decreased significantly in recent decades. This decrease is thought to be due to a combination of climate change and natural variability.
Climate models project a decrease in the number of tropical cyclones, but an increase in the proportion of severe tropical cyclones. There is high confidence that extreme rainfall and extreme wind speeds caused by tropical cyclones will increase, and rising sea levels will increase coastal impacts. There is low confidence in projected changes in the number of severe cyclones (Categories 4–5) and the possible poleward shift. More information on tropical cyclones is available through the website and NESP ESCC Hub (2020).
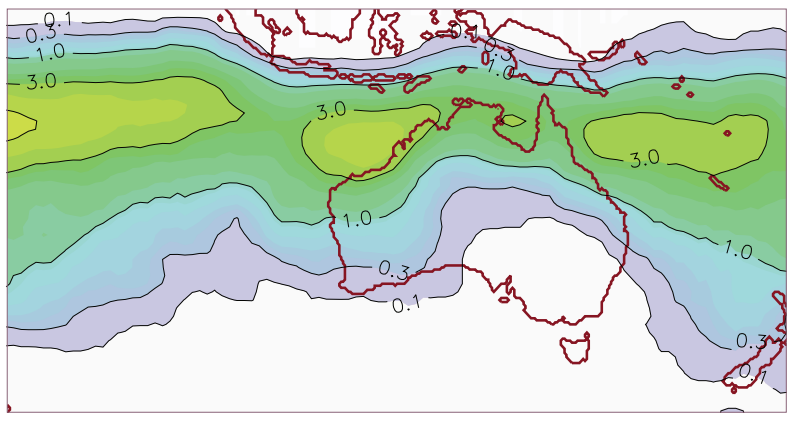
Figure 1 Average number of tropical cyclones per year. Tropical cyclone tracks are sourced from the Bureau of Meteorology, as well as government agencies in neighbouring countries 1982–2017. (Source: Chand et al. 2019 )
Hailstorms
The annual average number of days with large hail (greater than 25 mm diameter) varies considerably between different locations in Australia and there is limited information on giant hail (greater than 50 mm diameter), which causes the most damage (Dowdy 2020a).
Large hail occurs more often (5–10 events annually) in the central east than elsewhere in Australia, with up to five events annually for regions around major cities, although there are significant discrepancies between studies.
The influence of climate change on hail is uncertain due to the limited historical measurement period and the ability of climate models to represent the physical processes required for simulating hail events (including fine-scale convective processes and microphysics). There is some indication of a poleward shift in suitable conditions for hail occurrence. The influence of climate change on hail represents a significant gap in knowledge.
Thunderstorms and lightning
Thunderstorms are small-scale weather systems associated with hazards such as lightning, hail, extreme winds, tornadoes, extreme rainfall and flash flooding. Thunderstorms can disrupt power networks, damage property and cause injury or loss of life. Lightning can cause bushfires, leading to a range of further impacts to communities, businesses and ecosystems.
Thunderstorms in Australia occur predominantly during warmer months, with more activity in the north and east of the continent. Thunderstorms can combine with other weather events such as tropical cyclones, east coast lows and cold fronts, resulting in more extreme weather conditions from those compound events (Dowdy and Catto 2017). From 1979 to 2016, there is some evidence that thunderstorms and dry lightning decreased in spring and summer in northern and central Australia, decreased in the north in autumn, and increased in the south-east in all seasons. Convective rainfall intensity per thunderstorm increased by about 20% in the north and 10% in the south (Dowdy 2020b).
Climate models indicate a potential increase in future thunderstorm frequency for parts of eastern Australia, while changes for other regions are more uncertain. Extreme rainfall caused by thunderstorms is likely to increase in intensity resulting in increased flood risk factors in some cases.
More information on this topic is available through the NESP ESCC Hub (2020).
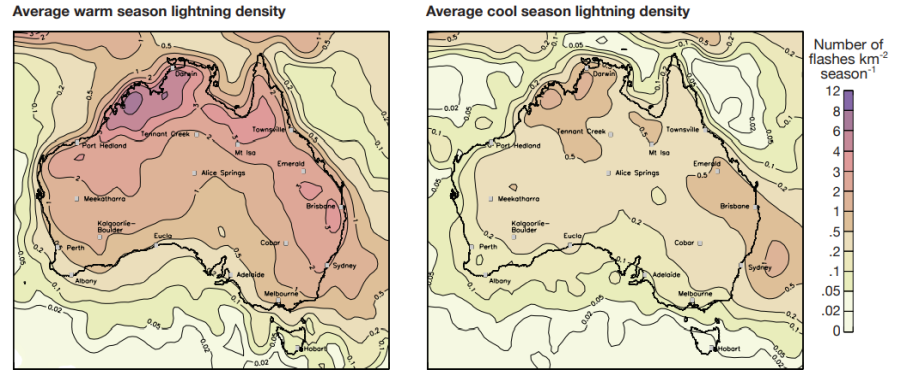
Figure 2 Thunderstorm climatology for Australia as indicated by satellite observations of lightning. Cloud-to-ground lightning flashes (average number per square kilometre) are shown for the years 1995–2012. (Source: Dowdy and Kuleshov 2014 )
Flooding
NESP ESCC Hub (2020) states that there are considerable uncertainties regarding trends and projections of some kinds of flood events but the risk factors for other flood events, such as coastal flooding exacerbated by sea level rise, can be projected with high confidence. The increased atmospheric moisture content due to global warming can increase rainfall extremes, thereby increasing flood risk caused by localised severe thunderstorms. However, the relationship between increased rainfall and flood (depth, extent or speed of flow) may not depend only on increased rainfall. Additional risk factors include soil moisture content, runoff and snowmelt.4 Furthermore, other activities can have large influences on flood risk, particularly including water management and land-use changes (such as changes to reservoir infrastructure or operations).
Weather systems that contribute to floods include thunderstorms, fronts, troughs and low-pressure systems, and in some regions, tropical cyclones and east coast lows.
Rising sea levels are likely to increase the risk of flooding in coastal and estuarine regions as storm surges and extreme wave activity both contribute to flooding potential.
Extreme sea levels
Global average sea level has risen by over 20 cm since 1880 and is rising at around 3.6 mm per year (IPCC 2019). Around Australia, relative sea level rose 3.4 mm/year 1992–2019 (Watson et al. 2020).
Sea level is projected to rise more rapidly this century than last (very high confidence). Projections are available from CSIRO and BoM for selected locations, years and RCPs. The IPCC (2019) updated global average sea level rise estimates for the year 2100 are 29–59 cm for low emissions (RCP2.6) and 61–110 cm for high emissions (RCP8.5). These estimates are slightly higher than those published in 2013 because they account for accelerated loss of ice from Antarctica. The implications for extreme sea levels around Australia have not yet been assessed.
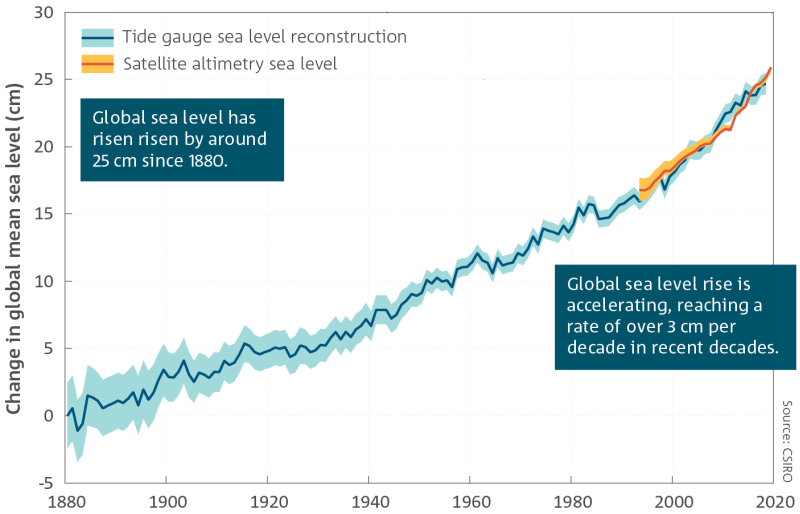
Figure 3: Annual global sea level change from 1880 in tide gauge data (1880–2019, blue line, shading indicates confidence range), and annual sea level changes in satellite altimetry (1993–2019, orange line). (Source: modified from BoM & CSIRO State of the Climate 2020 )
East coast lows
East coast lows are low-pressure systems that affect south-east Australia and can cause hazards including damaging winds, prolonged heavy rainfall, flooding and very rough seas. The more intense events can lead to injury, loss of life, infrastructure damage and large insurance losses, as well as benefits such as contributing to water resources in this densely populated region.
East coast lows occur on average about 22 times per year. There is large year-to-year variability in the number, with no clear trend over recent decades. Climate models project fewer east coast lows. The projections show larger reductions for higher greenhouse gas emission scenarios. However, rising sea levels are likely to increase the impact of large waves on coastal regions, and extreme rainfall is predicted to increase in intensity resulting in increased risk of flooding. There are still considerable uncertainties in scientific understanding of how some east coast low characteristics may change, including the intensity of extreme wind and wave direction.
More information on this topic is available from NESP ESCC Hub (2020) and a recent review study .
For compound extreme events, there are several ways that case studies from climate projections can be used for a risk analysis:
The Brattle Group (Chang 2020) identified three types of planning approaches: expected value; identifying the ‘least regrets’ option for investment decisions; and ’robust planning’ to ensure that the worst outcomes can be managed with the least cost.
A 'least worst' assessment is used for electricity planning in the UK and is applied when it is difficult or inappropriate to attach probabilities to future scenarios (Zachary 2016). It involves 'quantifying the worst possible outcomes for a set of strategic choices, and then identifying the choice with the “least-worst” outcome. In other words, a 'least worst regrets' solution finds the safest path that avoids the worst possible outcomes’ (Sanders 2016). This is a pragmatic option that avoids having to weight views of the future subjectively.2
Lloyd's insurance market requires insurance syndicates operating in the market to use a suite of ‘realistic disaster scenarios’ to stress-test their portfolio. These scenarios are geographically diverse and vary by asset and peril.3 This stress-testing is intended to identify common points of vulnerability in portfolios.
More information on case studies of extreme compound events is given below and a description of the use of these in the electricity sector appears in the ESCI Technical Report on compound events and in the associated ESCI case study. The National Environmental Science Program has developed relevant information on a number of hazards, summarised below.
EXTREME AND COMPOUND EXTREME WEATHER EVENTS
Extreme events have always been part of Australia's variable climate. However, climate change is expected to lead to changes that will produce ‘significant property, personal and economic damage and hardship’ (Bruyère et al. 2019).
The frequency of extreme temperatures, extreme rainfall and extreme fire danger days has increased in recent decades (BoM and CSIRO 2020) (Figure 4 shows historical changes in extreme temperature events).
Read more...
Australia's climate is influenced by the El Niño Southern Oscillation, the Indian Ocean Dipole and the Southern Annular Mode.5 These three global climate phenomena fall into or out of phase, leading to extreme rainfall and temperature variability. Climate change adds strong trends in both temperature and rainfall as well as unpredictable changes in the underlying drivers; for example, climate modelling provides evidence for a potential doubling in the occurrences of extreme El Niño events (Cai et al. 2014).
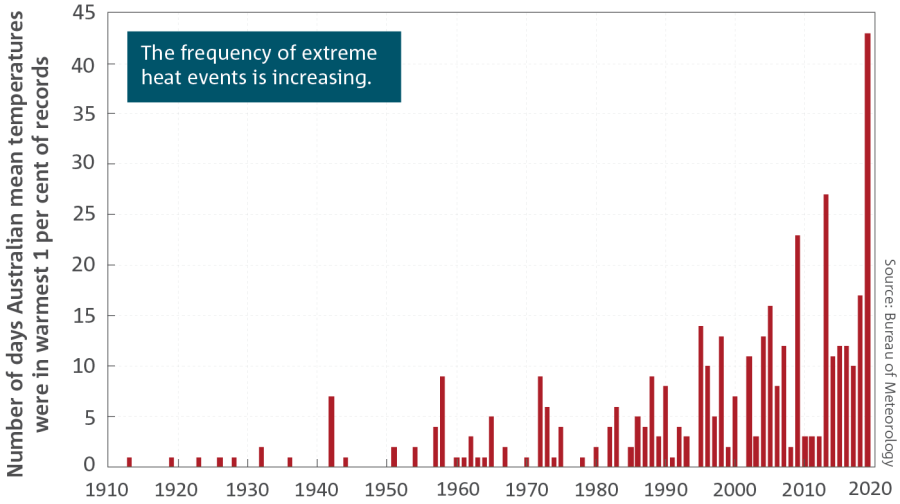
Figure 4 Number of days each year where the Australian area-averaged daily mean temperature for each month is extreme. Extreme daily mean temperatures are the warmest 1% of days for each month, calculated for the period from 1910 to 2019. (Source: BoM & CSIRO )
The predicted increase in the frequency and severity of extreme weather events will challenge Australia's electricity infrastructure. Some of the expected changes include:6
- increased frequency of large-scale heatwaves and record high temperatures
- longer fire season with more extreme fire danger days
- reduced annual rainfall, particularly during the cooler months in southern Australia
- an increase in heavy daily rainfall intensity
- increased frequency of coastal storm surge inundation as sea levels rise
- a reduction in the total number of tropical cyclones but an increase in the proportion of high intensity storms
While individual events or localised weather extremes pose local or asset-specific risks, compound events in which multiple adverse impacts occur concurrently or in quick succession pose challenges to whole of system resilience. Severe compound (multiple impacts) and extreme events result in widespread exposure to hazards and severe consequences for consumers. There is the additional risk of compounding failure of other systems, such as transport and telecommunications (Cainey 2019) The ESCI technical report on decision-making for extreme and compound events presents more information on this subject.
Examples of compound extreme events include:
- the heatwave in late January and early February 2009, followed by the devastating 'Black Saturday' bushfires in Victoria
- a multiple tornadic storm event in September 2016 that led to the loss of power for 850,000 customers ('Black System')
Extreme weather case studies should be used to test the impact of extreme and compound events on the national electricity market. An example of this is given in the ESCI case study on system impacts of extreme and compound weather events.
A scenario approach, using multiple scenarios to identify common points of system weakness or mitigation benefit, is consistent with recommendations from financial and insurance risk management processes, such as the and the National Disaster Risk Reduction Framework (Department of Home Affairs 2019).
Case study of an extreme weather event
To develop a quantitative case study for use in stress-testing, the ESCI project identified an event in the climate projections with the synoptic characteristics of ‘Black Saturday’.7 This included a multi-jurisdictional heatwave followed by a strong cold front, driving high winds and low humidity in south-east Australia (see Figure 5).
The scenario for the year 2031 includes conditions that in most cases exceeded those of 2009:
- drought preceding the event, and dangerously high Forest Fire Danger Index in some parts of the NEM
- six days of multi-jurisdictional heatwave in conditions warmer than the present; a significant difference from the 2009 event is the extreme heat along the south-eastern seaboard
- a strong cold front, producing strong winds
This event was used in the ESCI Case Study on extreme compound events.
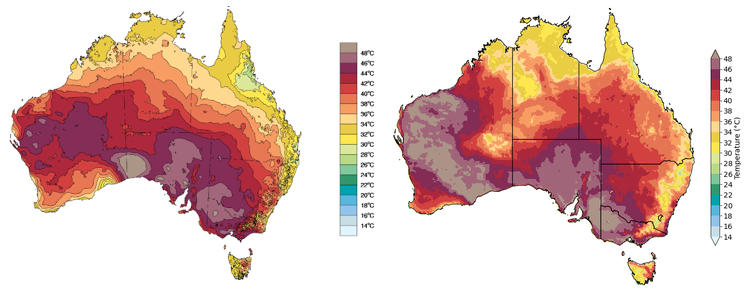
Figure 5. Maximum temperatures from the ESCI Case Study: Extreme weather and the power system
REFERENCES
BoM and CSIRO (2020). State of the Climate 2020 . Bureau of Meteorology and Commonwealth Scientific Industrial Research Organisation.
Bruyère C, Holland G, Prein A, et al. (2019). Severe weather in a changing climate Insurance Australia Group and National Center for Atmospheric Research, November.
Cai W, Borlace S, Lengaigne M, et al. (2014). 'Increasing frequency of extreme El Niño events due to greenhouse warming' Nature Climate Change 4:111–16 https://doi.org/10.1038/nclimate2100
Cainey JM (2019). 'Resilience and reliability for electricity networks' Proceedings of the Royal Society of Victoria131:44–52. https://doi.org/10.1071/RS19005
Chang J, Donohoo-Vallett P, Ruiz P, et al. (2020). Potential for Incorporating Climate-Related Risks into Transmission Network Planning; a review of frameworks and responses Prepared for the Australian Electricity Market Operator, June 2020.
Department of Home Affairs (2019). Climate and Disaster Risk: What they are, why they matter and how to consider them in decision making. 3 Guidance on Scenarios https://www.aidr.org.au/media/6932/04-scenarios.pdf
Dowdy AJ and Catto JL (2017). 'Extreme weather caused by concurrent cyclone, front and thunderstorm occurrences' Scientific Reports 7:40359. https://doi.org/10.1038/srep40359
Dowdy AJ and Kuleshov Y (2014). 'Climatology of lightning activity in Australia: spatial and seasonal variability' Dowdy AJ, Kuleshov Y (2014) Climatology of lightning activity in Australia: spatial and seasonal variability. Australian Meteorology and Oceanography Journal 64:103-118 :103–118
Dowdy AJ, Pepler A, Di Luca A, et al. (2019). 'Review of Australian east coast low pressure systems and associated extremes' Climate Dynamics 53:4887–910. doi.org/10.1007/s00382-019-04836-8
Dowdy AJ, Soderholm J, Brook J, et al. (2020). 'Quantifying hail and lightning risk factors using long-term observations around Australia' Journal of Geophysical Research:Atmospheres 125:2020JD033101. https://doi.org/10.1029/2020JD033101
IPCC (2019): IPCC Special Report on the Ocean and Cryosphere in a Changing Climate H-O Pörtner, DC Roberts, V Masson-Delmotte, et al. (eds)
NESP ESCC Hub (2020). Scenario analysis of climate-related physical risk for buildings and infrastructure: Climate science guidance. Climate Measurement Standards Initiative
Sanders D, Hart A, Ravishankar M, et al. (2016). An Analysis of Electricity System Flexibility for Great Britain PDF London: Carbon Trust/Imperial College.
Watson PJ (2020). 'Updated mean sea-level analysis: Australia'Journal of Coastal Research 36:915–31, 917. https://doi.org/10.2112/JCOASTRES-D-20-00026.1
Zachary S (2016). 'Least worst regret analysis for decision making under uncertainty, with applications to future energy scenarios'. Least worst regret analysis for decision making under uncertainty, with applications to future energy scenarios
NOTES
1 The intention is to apply these indices to assess future severe convective wind risks; this work is ongoing.
2 Network Options Assessment Methodology Review, UK National Grid UK National Grid
3 See, for example, RDS 2020 Scenario Specification, 2020. (PDF )
4 The ESCI project provides data on soil moisture and streamflow trends, intensity and frequency.
5 See ESCI Webinar : 'The influence of climate change on the Australian Bushfire Season', for more explanation of how the underlying phenomena affect weather extremes.
6 See for example BOM climate extremes and NESP ESCC work on extremes and natural hazards . The ESCI project provides data on soil moisture and streamflow trends, intensity and frequency.
7 See ESCI Technical Report on using extreme and compound case studies for decision-making.
Downloads
DownloadGuidance Step 3.2 and all figures (zip 1.6 MB)