Climate Change in Australia
Climate information, projections, tools and data
Extreme temperature
Recent increasing trends in mean temperature have been accompanied by a large increase in extreme temperatures.
Since 2001, the number of extreme heat records in Australia has outnumbered extreme cool records by almost 3 to 1 for daytime maximum temperatures, and almost 5 to 1 for night-time minimum temperatures. Very warm months (those with monthly averaged temperature above the second standard deviation of monthly temperatures from a 1951-1982 reference period) have increased five-fold in the past 15 years.
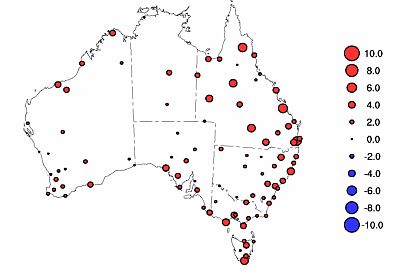
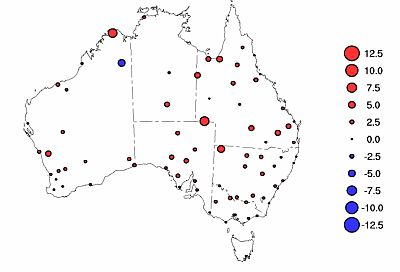
The frequency of very cool months has declined by around a third over the same period. The figures below show Australia-wide trends in days above 35 °C and trends in the temperature of the coldest night since 1950 (Technical Report Section 4.2.1).
The changes in the frequency of temperature extremes have been shown to be directly related to warming trends. These changes include recent, significant increases in the frequency of high-temperature extremes and decreases in the frequency of low temperature extremes, and increases in the duration, frequency and intensity of heatwaves in many parts of the country. Extreme heat was experienced during the Australian summer of 2012-2013.
Near-surface air temperatures and regional sea-surface temperatures for the December to February period were the highest on record for Australia. This period also included Australia’s area-averaged hottest month, hottest week and hottest day on record, and the longest and most spatially extensive national heatwave on record. Analysis with forced and unforced climate model simulations show that increasing greenhouse gases lead to a five-fold increase in the odds of Australia recording the temperatures experienced in January 2013.
For more detail, including the context of other variables and climatic influences, see the Technical Report (Section 4.2.1). Also see the Bureau of Meteorology Annual Climate Report (2015).

Trends in the number of hot days (greater than 35 °C) in Australian mean temperature from the Australian climate observations reference network of surface air temperature (ACORN-SAT) from 1950 to 2013. SOURCE: Bureau of Meteorology.

Trends in the coldest night (°C) in Australian mean temperature from the Australian climate observations reference network of surface air temperature (ACORN-SAT) from 1950 to 2013. SOURCE: Bureau of Meteorology
Page updated 17th December 2020


