Climate Change in Australia
Climate information, projections, tools and data
Case Study: Extreme weather & the power system
Full Case Study
(pdf 2.1 MB)
- Why Was This Case Study Chosen?
- How Did the Case Study Use Climate Data?
- What Did We Find?
- What Similar Problems Could This be Applied to?
- Downloads
Why was this case study chosen?
This document provides an overview of a case study where a compound extreme weather event, identified in the climate projections, is modelled to assess the potential impact on energy supply in the national electricity market (NEM) and to test system resilience.
Compound extreme events are considered in climatology to be ‘two or more events occurring simultaneously, [that] can lead to high impacts, even if the two single events are not extreme per se’.1 Single variable extremes (such as extreme rainfall or extended heatwaves) can be extracted from climate trend projections which provide some information on recurrence intervals or probability. It is extremely difficult to provide probability information for a combination of already rare events in a changing climate, however, plausible compound extreme events can be extracted from the climate projections and used to test system resilience.
How did the case study use climate data?
The weather event chosen for this case study is taken from the global climate model CanESM2 in a high emissions scenario2 RCP8.5, which has been downscaled with CCAM (a regional climate model) to increase the resolution over Australia and enable a better representation of weather around topography. While the event was found in the simulated year 2045, the case study is set in the 2030–2031 financial year. Given the natural variability of the Australian climate, this is a plausible event at any time in the next 30 years. The time frame facilitates system modelling based on the Central 2020 Integrated System Plan (ISP) Scenario.
The event starts with a heatwave moving across most of the NEM, with Sydney and Canberra experiencing a ‘severe heatwave’ and Adelaide, Melbourne and Hobart experiencing an ‘extreme heatwave’.3 The heatwave breaks down over the southern part of the NEM following the passage of a very strong frontal system.4 This system has an associated change in wind direction as well as wind gusts, providing an environment conducive to devastating fire conditions (analogous to Black Saturday and Ash Wednesday).
The scenario presented is a hypothetical future scenario—that is, the dates on graphs are not factual and are included for reference only. While the events are designed to be slightly beyond those captured in the recent historical record, the magnitude of the heat experienced is similar to recent significant historical heatwaves (e.g. 2009, 2014), however, heatwaves compounding temporally over all major power demand centres is unprecedented.
What Did We Find?
Electricity supply for the NEM was modelled using AEMO market models, which include temperature response functions for both demand and supply.5 The particular weather pattern selected in this study represents conditions associated with extreme bushfire risk (hot, dry and windy). The case study simulated a bushfire affecting transmission paths across Victoria to New South Wales for a two-week period beginning at the start of the heatwave.
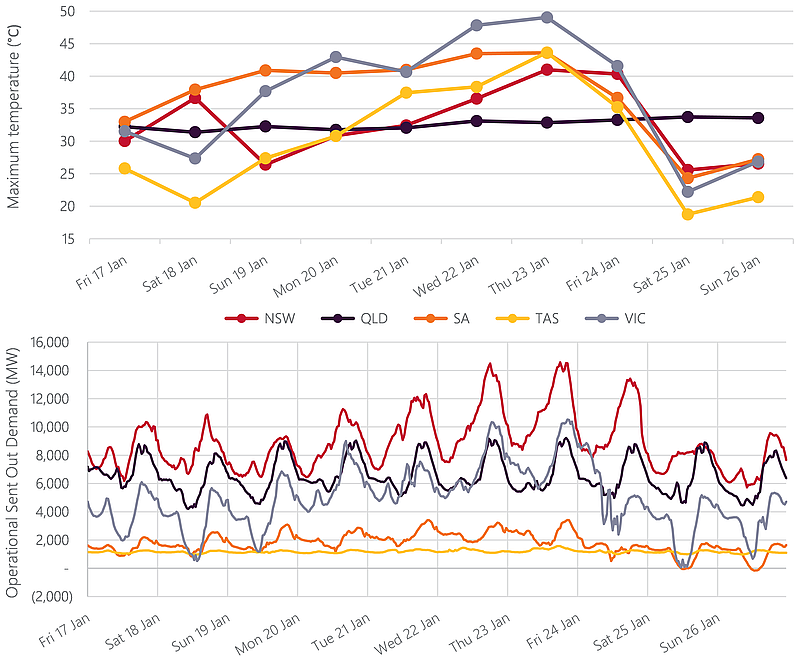
Figure 1 Maximum temperature over the days of the ‘event’ in 2031 (upper graph) and electricity supplied (‘operational sent out demand’) on the corresponding days (lower graph) (modelling by AEMO).
The USE (unserved energy) during normal weather years is expected to be close to zero. USE during the case study event occurs in New South Wales, Victoria and South Australia where the heatwaves occur, while the simulated bushfire resulted in significant USE in New South Wales (Figure 2).
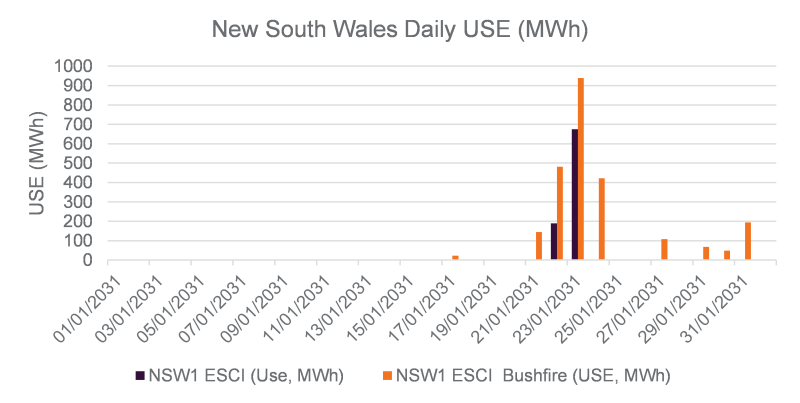
Figure 2. Daily USE in New South Wales due to bushfires compounding a heatwave event throughout the study.
What similar problems could this be applied to?
The ESCI project demonstrated that extreme compound events can be identified in the climate projections. The value of this approach is that it presents a quantitative, coherent picture of how the climate variables change over time and regions. This can be used as input to consequence models providing a quantitative impact assessment for the case study. Using compound extreme event case studies allows sector organisations to stress test the power system and to explore possible vulnerabilities and risk management solutions. While the studies do not provide immediate input to quantitative cost-benefit analysis studies (because of the lack of probability information), they support risk exploration such as:
- Is the risk of this event material?
- How does this event align with societal tolerance for impacts?
- What solutions might mitigate these risks?
- How do different proposed investments perform in extreme events?
More detail on the use of compound extreme event projections is available in the ESCI Technical Report on decision-making using extreme event case studies.
For more detail on this assessment please see the full Case Study report (pdf 2.1 MB).
The ESCI User Guidance explains how to conduct your own risk assessment.
Notes
1 Intergovernmental Panel on Climate Change (IPCC) Special Report on Climate Extremes (SREX), 2012. https://www.ipcc.ch/site/assets/uploads/2018/03/SREX-Chap3_FINAL-1.pdf
2 RCP8.5 was chosen as a high global warming scenario in order to provide an event to stress test the power system. See ESCI Key Concepts —Choosing representative emissions pathways.
3 Heatwave classifications and Bureau of Meteorology standard terminology.
4 Reeder, Spengler and Musgrave found that the most catastrophic fire conditions in recent history in southern Australia have been associated with particularly strong summer cold fronts. Reeder MJ, Spengler T, and Musgrave R (2015). 'Rossby waves, extreme fronts and wildfires in southeastern Australia' Geophysical Research Letters. https://doi.org/10.1002/2015GL063125
5 See for example ESCI case studies on the impacts of extreme temperatures on transmission line ratings and variable renewable energy .
Downloads
DownloadFull case study report and all figures (zip 2.8 MB)