Climate Change in Australia
Climate information, projections, tools and data
Step 4: Evaluate all Risks
Guidance Step 4
(pdf 618.9 KB)
Overview
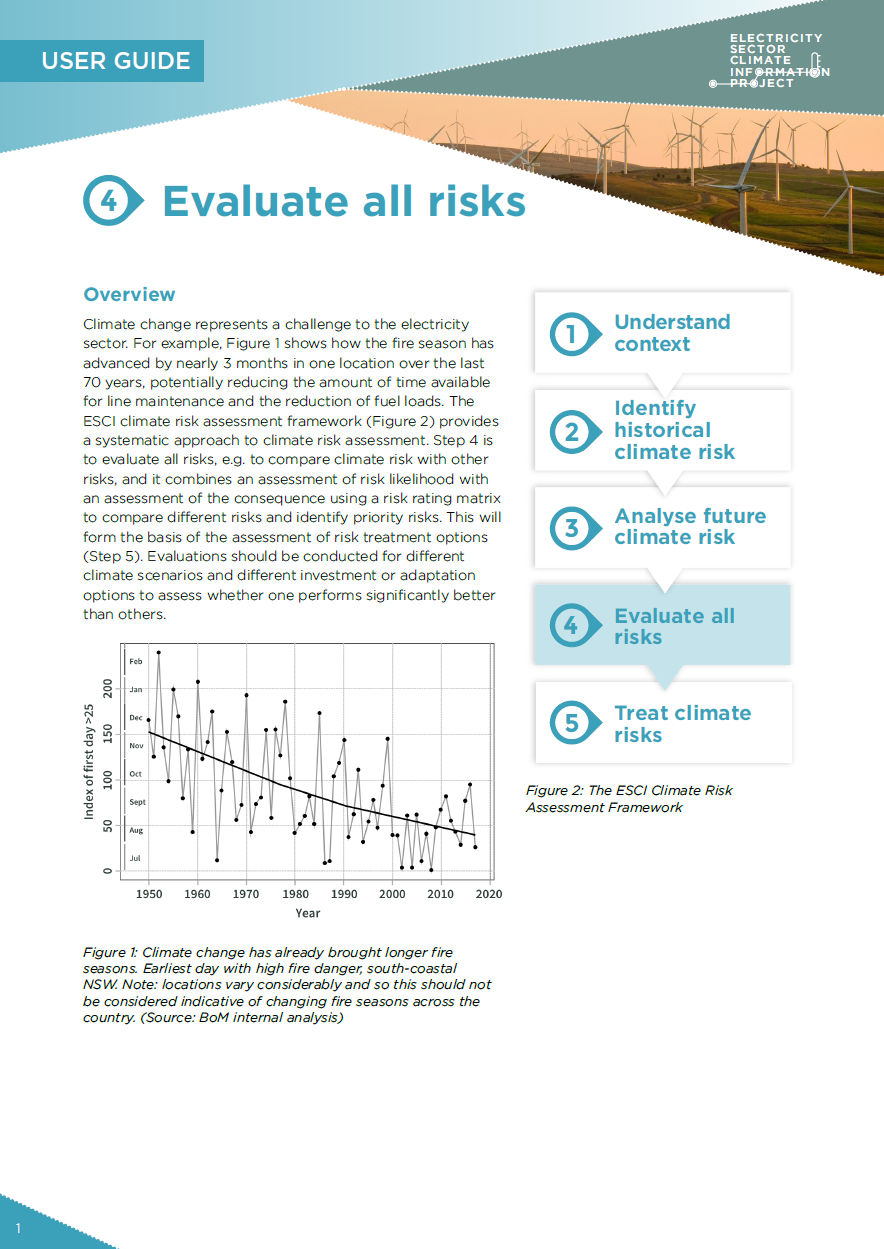
Climate change represents a challenge to the electricity sector. For example, Figure 1 shows how the fire season has advanced by nearly three months in one location over the last 70 years, potentially reducing the amount of time available for line maintenance and the reduction of fuel loads. The ESCI Climate Risk Assessment Framework (Figure 2) provides a systematic approach to climate risk assessment. Step 4 is to evaluate risks, that is, to compare climate risk with other risks, and it combines an assessment of risk likelihood with an assessment of the consequence, using a risk rating matrix to compare different risks and identify priority risks. This will form the basis of the assessment of risk treatment options (Step 5 ). Evaluations should be conducted for different climate scenarios and different investment or adaptation options to assess whether one performs significantly better than others.
")
Figure 1 Climate change has already brought longer fire seasons. Earliest day with high fire danger, south-coastal New South Wales. Note: locations vary considerably and so this should not be considered indicative of changing fire seasons across the country. (Source: BoM internal analysis)

Figure 2 The ESCI Climate Risk Assessment Framework.
CONSTRUCTING A RISK MATRIX
Risk evaluation is based on the outcomes of a risk analysis (Step 3 in the Framework). The consequences on system performance and/or the financial implications are combined with likelihood (or probability) of the event occurring to produce a risk rating matrix (Table 3). This is a tool to rank or prioritise the risks and to consider risk mitigation options (Step 5 ). Extreme risks have highest priority for immediate action, high risks may require more detailed research and planning to determine the treatment, moderate risks may require changes to design standards and maintenance, and low risks may be managed through routine maintenance. Risk evaluation may lead to further, or more detailed, risk analyses if rankings are unclear.

Figure 3 Typical risk rating matrix, which involves combining the likelihood of a particular risk with the consequence.
The organisation should define criteria to evaluate the significance of current and future climate risks, consistent with criteria used for other types of risk. Some criteria may be related to legal and regulatory requirements, or the organisation’s climate risk management policy. The organisation should consider:
- the nature and magnitude of the consequences of climate-related risks and how they will be measured
- secondary consequences in terms of human safety and health, loss of utility, financial impact and disruption
- aversion to certain types of consequences
- timing and time frame of the consequences
- persistence and reversibility of the consequences
Defining consequence
Table 1 provides examples of risk consequence criteria that may be used in risk evaluation. These criteria are consistent with the National Electricity Objective, which considers price, quality, safety, reliability and security.
Consequence | Infrastructure, Service | Social | Governance | Financial | Environmental | Economic |
|---|---|---|---|---|---|---|
Insignificant | Not affected | Not affected | Not affected | Not affected | Not affected | Not affected |
Minor | Minor disruption/ repairs requiring early renewal of 10–20% of infrastructure | Minor disruption or health impacts for employees or customers | Concern raised by regulators requiring a response | Higher operating costs. Financial loss of < 10% | Minor impacts | Minor impact due to disruption of service |
Moderate | Moderate disruption and repairs requiring early renewal of 20–50% of infrastructure | Frequent disruption or health impacts for employees or customers | Investigation by regulators requiring management changes | Moderate financial loss of 10–50% | Moderate damage including local ecosystems. Some remedial action may be required | Moderate impact on local economy, with some impact on wider economy |
Major | Major disruption and repairs requiring early renewal of 50–90% of infrastructure | Severe disruption or health impacts including serious injuries or fatalities | Notices issues by regulators for corrective action. Senior management responsibility questioned. | Major financial loss of 50–90% | Significant damage. Remedial action likely | Major impact on local economy, spreading to wider economy |
Catastrophic | Significant damage and/or complete loss of service requiring early renewal of > 90% of infrastructure | Emergency response required. Total disruption and multiple fatalities. | Major policy shifts. Change to legislation and senior management. | Extreme financial loss of > 90% | Extreme damage, including loss of species, habitats or ecosystems. Extensive remedial action likely. | Extreme impacts on local, regional and state economies |
Defining likelihood
Table 2 provides likelihood metrics according to Standards Australia AS-5334 and the Intergovernmental Panel on Climate Change (IPCC) that can be used as a basis of an evaluation.
Likelihood | Probability (AS-5334) | Probability (IPCC) |
|---|---|---|
Almost certain | > 90% | > 99% |
Likely | 60–90% | 66–100% |
Possible | 40–60% | 33–66% |
Unlikely | 10–30% | 0–33% |
Rare | < 10% | < 1% |
EVALUATION IN PRACTICE
A climate risk evaluation can be undertaken through an expert elicitation process, via interviews or through surveys. There may be differing views about consequences and likelihoods so iteration may be required to reach consensus. Table 3 provides some examples of the likelihood and consequence of different climate risks from the Energy Networks Australia climate risk and resilience manual (ENA 2014)1 and Figure 4 shows where these climate risks may occur in a corresponding example risk matrix.
Hazard | Consequence | Likelihood | Risk rating |
|---|---|---|---|
Rainfall | R1: Floods that result in damage to sub-stations and indirect damage to overhead wires, underground pipes and cables (Major) | Likely | High |
R2: Seasonal average rainfall changes can cause maintenance and repair issues to underground cables and pipes (Moderate) | Possible | Moderate |
|
R3: Drought can reduce thermal buffering of underground cables and can cause indirect damage to overhead structures (Moderate) | Possible | Moderate |
|
Temperature | T1: Extreme temperatures may alter peak demand and reduce the efficiency of overhead lines, cables and transformers (Major) | Likely | High |
T2: Average temperature changes may reduce the efficiency of overhead lines, cables and transformers, and increase the sag of overhead lines (Major) | Likely | High |
|
Fire | F1: Fires may affect overhead lines and wooden poles (Major) | Likely | High |
Wind | W1: Extreme wind speeds can damage overhead networks (Major) | Likely | High |
W2: Average wind speed changes and increased frequency and intensity of extreme wind events can damage overhead lines and cause over-voltages, affecting transformers (Major) | Possible | High |
")
Figure 4 Risk rating matrix based on consequence and likelihood. Green represents low risk, yellow moderate risk, orange high risk and red extreme risk. (Modified from ENA 2014)
Other risks, such as economic, policy, technology and litigation risks, can be placed on the same risk matrix—doing so will help establish the priority for treatment of climate risk (Step 5). Completing the matrix for a range of climate risks may require Step 3: Analyse Future Climate Risk, to be repeated to consider multiple coincident hazards or non-linear system responses. The power system response to a climate hazard will depend on asset and infrastructure configurations, engineering specifications and the location and vulnerability of consumers. A small change in climate could result in major impacts on the electricity system. For example, solar panels, wind farms and the Basslink Interconnector have temperature thresholds beyond which function drops off sharply.
CONCLUSION
Climate risk is one of a number of risks facing the electricity sector. A risk matrix can be used to prioritise climate risk against other business risks, but developing a plan to treat these risks through mitigation or adaption requires a cost-benefit analysis. This is likely to vary for different businesses and is described in Step 5: Treat climate risk.
If the climate risk identified is significant, or the risk treatment option is expensive, the ESCI project recommends seeking advice from expert climatologists to help analyse the climate risk and conduct sensitivity analyses to identify potential thresholds associated with major impacts.
REFERENCES
Energy Networks Australia (2014) Climate Risk and Resilience - Industry Guidance Manual
. ENA DOC 036-2015. Energy Networks Australia.
IPCC (2013). Summary for Policymakers. In: Climate Change 2013: The Physical Science Basis.Contribution of Working Group I to the Fifth Assessment Report of the Intergovernmental Panel on Climate Change (eds TF Stocker, D Qin, G-K Plattner, et al.) Cambridge: Cambridge University Press
NOTES
Downloads
1EXHIBIT 15-010.008 - EAU.500.001.0128 - Attachment Q10_A1 to Dr Jill Cainey's witness statement - ENA Climate Risk and Resilience Industry Guidance Manual. Royal Commission into National Natural Disaster Arrangements
DownloadGuidance Step 4 and all figures (zip 737.9 KB)