Climate Change in Australia
Climate information, projections, tools and data

Accessing VCP19 datasets
Regionally averaged change summaries
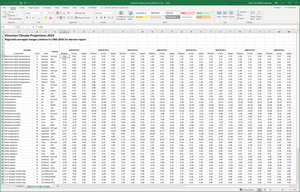
Summaries of the regionally averaged projected changes in 11 climate variables are available for download in spreadsheet format. These data are available for each of the ten VCP19 Regions (see the map of regions on the Getting Started page). These region-wide values were computed from the gridded change data described below so represent future change compared to the mean climate of 1986-2005 (see graph below). The spreadsheets also provide available GCM results computed using the relevant 'GCM Region'. The summary tab of each spreadsheet presents the results from the CCAM high-resolution simulations with notes indicating if the GCM results expand the range of projected change.
These data are ideal for a first look at plausible future climates, particularly for a 'first pass climate impacts assessment'. Each spreadsheet file contains a ReadMe tab that describes the data in detail.
Click the appropriate download link below.
Barwon Region Projected Change Summary (Excel) (1.2 MB)
Central Highlands Region Projected Change Summary (Excel) (1.2 MB)
Gippsland Region Projected Change Summary (Excel) (1.2 MB)
Goulburn Region Projected Change Summary (Excel) (1.2 MB)
Great South Coast Region Projected Change Summary (Excel) (1.2 MB)
Greater Melbourne Region Projected Change Summary (Excel) (1.2 MB)
Loddon Campaspe Region Projected Change Summary (Excel) (1.2 MB)
Mallee Region Projected Change Summary (Excel) (1.2 MB)
Ovens Murray Region Projected Change Summary (Excel) (1.2 MB)
Wimmera Southern Mallee Region Projected Change Summary (Excel) (1.2 MB)
Future (projections) gridded and point datasets
The 5 km projection data were produced using CCAM to downscale six host global climate models (GCMs) for two greenhouse gas emissions pathways, medium emissions (RCP4.5) and high emissions (RCP8.5). See the Technical Report (download from here ) for more detail.
The data are provided in NetCDF format and are stored on a THREDDS server in a CORDEX DRS compliant directory structure.
Horizontal datum: All gridded data are on the WGS84 geographic datum.
The free software, Panoply is useful for viewing NetCDF data and can also export data to text and csv formats.
Instructions for importing NetCDF format into ArcGIS are provided here .
The links below provide shortcuts directly to the relevant data. If you have problems with downloads consistently failing, please check the CCIA News & Updates page for advice on any relevant outages or bugs. If there are no relevant outages or bugs listed, please contact us.
Projected Change Data
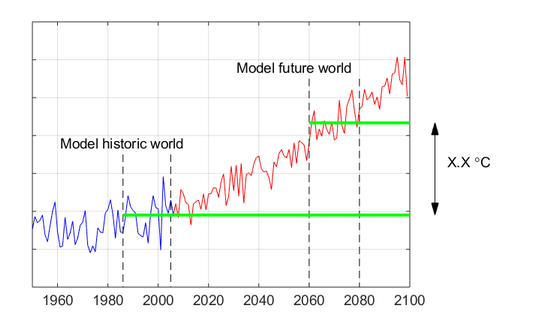
Projected change (compared with 1986-2005) data are available on the 5 km CCAM grid for each of the six simulations. These data provide the 20-year averaged monthly, seasonal and annual changes for four time periods centred on 2030, 2050, 2070 & 2090 (see figure) for two greenhouse gas emissions pathways (RCP4.5 & RCP8.5).
To access these data:
Click the "Gridded (5 km) change datasets" button below, then:
- Click on the variable of interest
- Click on the time-period of interest
- You will then see a list of files. See below for the explanation of the file naming convention.
- Click on the file you wish to download
- The catalogue entry for the file will now appear. This includes multiple options for accessing the data.
- To download a copy of the file, click the "HTTPServer" link. (This will trigger the usual browser download process.)
- If offered a choice, it is best to Save the file (opening the file from here is generally not a good idea)
For assistance understanding the file names, check the VCP19 File Naming Convention which applies to all VCP 19 datasets, except the spreadsheets described above.
For many purposes (such as a quick first look at likely areas of greatest vulnerability), projected change relative to 1986-2005 is sufficient.
For detailed impact assessments though, you're likely to need to have data showing likely future temperatures, rainfall amounts etc., perhaps as time-series. If this is the case you can:
- Use the "application-ready" datasets described below.
- Apply the projected change values to observed data yourself. A range of observed data are available from the Bureau of Meteorology (see below) or you may have collected your own data using data loggers or similar. Note that the observed data should be aligned with the relevant baseline period of the projected change data (usually 1986-2005).
Application-ready gridded (5 km) datasets
These application-ready datasets combine gridded observed data with gridded climate projections to produce plausible future climate data at daily, monthly, seasonal and annual time steps on the high-resolution 5 km grid. These data are appropriate to use as inputs to quantitative impact assessment processes, such as crop growth modelling and species distribution modelling.
The datasets have been developed using a quantile-quantile scaling approach. In this technique, high-quality observational 5 x 5 km gridded data have been modified by the projected percentile changes from the high-resolution climate modelling. This produces internally consistent datasets that preserve the spatial and temporal relationships in the observations while also capturing any projected changes in climate variability from the climate model.
A detailed description of a similar method is available here , under "quantile-quantile scaling". Note that for VCP19:
- The future change factors were obtained from the high-resolution CCAM model runs as opposed to GCM data.
- Changes were applied for every percentile.
Limitations
- As these datasets use the gridded observed datasets as a key input, the limitations of these gridded datasets flow through to the final dataset. The gridded observed data are produced using sophisticated techniques to 'infill' the data between BoM observing stations. The implications of this include:
- Comparison of the gridded data with a corresponding station will usually reveal differences. The size of these differences varies with location, and is largely dependent on the distance between observing stations.
- As the method applies projected changes to a fixed set of historic observations, the resultant data do not completely represent changes to climate variability.
- As the 30-year observed time-series is modified by time-slice averaged changes (albeit for each percentile), the resultant data represent a plausible future realisation of daily weather typical of the future mean climate state. Consequently, the time-series data for each future time period cannot be combined to form a continuous time-series spanning the whole of the 21st Century. Where such a continuous time-series is needed, the 'raw' CCAM output (see below) could be used if a bias-correction is carefully applied to them.
To access these data:
The datasets are divided into two sets: Daily time-series files and Aggregated files containing Monthly, seasonal and annual data as time-series.
To access them, click the appropriate 'time-series' button, below, then:
- Click on the variable of interest
- Click on the time-period of interest
- You will then see a list of files. See below for the explanation of the file naming convention.
- Click on the file you wish to download
- The catalogue entry for the file will now appear. This includes multiple options for accessing the data.
- To download a copy of the entire file (approx. 1.2 GB), click the "HTTPServer" link. (This will trigger the usual browser download process.)
- To download a subset of the file, click the "NetcdfSubset" link. This opens another window:
- You can adjust the 'bounding box' and 'time range' of the data to download.
- There is an option to add latitude and longitude fields to the data, which can be useful for some applications.
- Tick the checkbox next to the variable name on the left of the screen
- Choose the download format: NetCDF or NetCDF4 (stronger compression)
- Click the 'Submit' button (which will trigger your browser's usual download process).
- If offered a choice, it is best to Save the file (opening the file from here is generally not a good idea)
For assistance understanding the file names, check the VCP19 File Naming Convention which applies to all VCP 19 datasets, except the spreadsheets described above.
Application-ready gridded (5 km) datasets - Daily time-series Application-ready gridded (5 km) datasets - Monthly, Seasonal & Annual time-seriesThresholds datasets (5 km gridded)
These datasets are derived from the gridded application-ready daily time-series described above. The data have been analysed to find the number of days (on average) when:
- Maximum daily temperature exceeds: 30, 31, 32 ... 44, 45°C
- Minimum daily temperature exceeds: 20, 21, 22 ... 29, 30°C
- Minimum daily temperature is less than: 0, 2, 4, ... 20, 22°C
Results for annual, seasonal and monthly totals are provided.
Limitations
As these datasets are derived from the application-ready daily time-series described above, the same limitations apply to the thresholds datasets.
To access these data:
Click the "Thresholds datasets (5 km gridded)" button below, then:
- Click on the variable of interest
- Click on the time-period of interest
- You will then see a list of files. See below for the explanation of the file naming convention.
- Click on the file you wish to download
- The catalogue entry for the file will now appear. This includes multiple options for accessing the data.
- To download a copy of the entire file (approx. 1.2 GB), click the "HTTPServer" link. (This will trigger the usual browser download process.)
- To download a subset of the file, click the "NetcdfSubset" link. This opens another window:
- You can adjust the 'bounding box' and 'time range' of the data to download.
- There is an option to add latitude and longitude fields to the data, which can be useful for some applications.
- Tick the checkbox next to the variable name on the left of the screen
- Choose the download format: NetCDF or NetCDF4 (stronger compression)
- Click the 'Submit' button (which will trigger your browser's usual download process).
- If offered a choice, it is best to Save the file (opening the file from here is generally not a good idea)
Application-ready town datasets
These application-ready data are available for a selection of towns across Victoria. These data have been extracted from the appropriate grid cell of the gridded application-ready datasets described above. This approach has the advantage of allowing data to be obtained for any location across Victoria.
However, the same limitations apply to these data as are described above under "Application-ready gridded datasets".
To access these data:
Click the "Application-ready town/location datasets" button below, then:
- Click on the variable of interest
- Click on the time-period of interest
- You will then see a list of files. See below for the explanation of the file naming convention.
- Click on the file you wish to download
- The catalogue entry for the file will now appear. This includes multiple options for accessing the data.
- To download a copy of the file, click the "HTTPServer" link. (This will trigger the usual browser download process.)
- If offered a choice, it is best to Save the file (opening the file from here is generally not a good idea)
For assistance understanding the file names, check the VCP19 File Naming Convention which applies to all VCP 19 datasets, except the spreadsheets described above.
Application-ready town datasetsHistorical datasets
Gridded observed datasets
The gridded observed datasets that were used to produce the application-ready gridded datasets are available for download here. These datasets are available as daily and monthly time-series, spanning the 30-year period 1981-2010.
Please note that the licensing and/or terms of use varies from dataset to dataset. By accessing these data, you accept responsibility to check and comply with the associated license conditions and/or terms of use.
Gridded observed datasetsBureau of Meteorology observations and trends
A wide range of observed data are available from the Bureau of Meteorology's Climate Data Online portal.
Clicking the button below will take you out of Climate Change in Australia, to the Bureau of Meteorology's website.
BoM Climate Data OnlineRaw CCAM Output Datasets
For the most advanced users, the raw CCAM simulation outputs are available for download. It is important to understand that all raw model output will contain some biases which must be accounted for when they are used (e.g. by applying a bias-correction). When doing so, it is crucial to ensure the relationships among the different variables are maintained (they must be 'internally consistent'). The "projected change" and "application-ready" datasets described above are free of such biases and are internally consistent.
The raw datasets provide data for a much larger number of climate metrics, as described on the CCAM Wiki .
RCP4.5 Raw Model Datasets RCP8.5 Raw Model Datasets------------
Page updated 24th December 2020