Climate Change in Australia
Climate information, projections, tools and data
Years at the +1.5 °C global warming level
Has Australia already had years consistent with the +1.5 °C global climate?
The average annual temperature of Australia in 2019 and 2024 was at or around the temperature expected to be the new long-term average (the 'new normal') when the world is at +1.5 °C since pre-industrial.
The world has had a calendar year at +1.5 °C (2024) but hasn’t crossed the long term average hasn’t reached the threshold of +1.5 °C warming level yet, and the 10-year mean temperature is not expected to reach this level until around 2030.
See also: Reaching Global Warming Levels
Due to climate variability, most places have already experienced a year or more consistent with what is expected to be the ‘new normal’ (the long-term average) at a +1.5 °C global warming level. This is not necessarily 2024, the year when the global average was at +1.5 °C, but due to regional climate variability, could be any recent year.
Have we already seen any such years in Australia?
The answer is yes, and it wasn’t just 2024.
Up to the last decade (2011-2020), the globe warmed by around +1.1 °C, Australia by around +1.6 °C, a ratio of around x1.4. This suggests that when the world is at +1.5 °C, Australia will be at around +2.1 °C since 1850–1900.
Using estimated warming from pre-industrial, the average temperature of Australia’s hottest year 2019 was at slightly above 2.1 °C and Australia’s second hottest year, 2024, was around 2.1 °C – making these years the likely equivalent to an average year in a +1.5 °C world, a kind of ‘temporal analogue’ for this change.
See also: Australian Warming
Australia
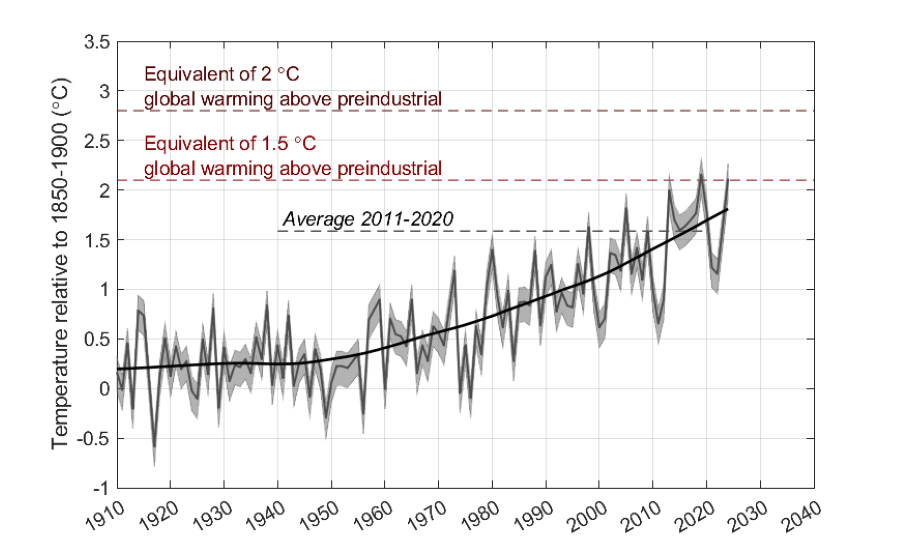
Notes on plot: it shows Australian average annual temperature in 1910 to 2024 relative to the 1850–1900 baseline, assuming the estimated warming from 1850–1900 to 1910–1930 from Australian Warming (the uncertainty bound on this estimate is shown added to the full series), lines show the Australian average annual temperature expected at each global warming level based on the observed ratio of regional to global warming to date, assuming this ratio continues (not using modelled regional projections)
These years are a temporal analogue for what the long-term average air temperature would be in those worlds, and for the kinds of atmospheric heat extremes than can occur. However, other aspects of these years will not be equivalent of the average year at these warming levels – the average rainfall will not be equivalent, and sea level takes a long time to come to an equilibrium so it would be much higher.
See: Australian Warming
States and Territories
The annual temperatures of states and territories do not always closely track the national average, and there are important differences from year to year, so will not always have the same temporal analogue of the +1.5 °C global warming level.
Years consistent with the expected average temperature when the world is at +1.5 °C in Australia’s states and territories:
- New South Wales and Australian Capital Territory: 2019
- Northern Territory: 1998, 2005, 2013, 2016, 2019, 2020
- Queensland: 2017, 2024
- South Australia: 2013, 2024
- Tasmania: none yet
- Victoria: none yet
- Western Australia: 2019, 2020, 2024
Page last updated 1st Dec 2025