Climate Change in Australia
Climate information, projections, tools and data
Reaching Global Warming Levels
When might we reach each global warming level? Global Warming Levels are defined by average global surface air temperatures over a 20-year period. We will move through the 1.5 °C warming level within the next ten years, though we only can precisely quantify the date we did after the fact. If and when we reach 2 or 3 or even 4 °C depends on the emissions pathway we follow.
1.5 Degrees
Recently, there have been times when the world has been more than 1.5 °C warmer than the average pre-industrial temperature – individual months, the first 12-month period (July 2023 to June 2024) and the first calendar year (2024). However, we have not yet reached a sustained 1.5 °C global warming level because reaching a warming level is based on a longer-term average, not a single month or year.
Strictly, the 20-year moving average of the global surface air temperature (GSAT) needs to be at or very near +1.5 °C relative to the pre-industrial climate for the +1.5 °C warming level to be reached. This is what we are calling a “+1.5 °C world”. The same conditions are used to define +2 and +3 °C global warming levels. Since we won’t know if we have formally reached 1.5 °C until 10 years after the fact, there are methods of estimating the current warming level as it approaches 1.5 °C – we are currently at around 1.34 to 1.41 °C, see Current Warming Level .
See this visualiser to see the latest Global Warming Level estimate and timing of reaching 1.5 °C using the extrapolation of current trends (credit: Copernicus)
We are projected to be at the 1.5 °C global warming level in around 2030 under all plausible scenarios of global change. We may overshoot 1.5 °C, return and then stabilise the global average temperature at 1.5 °C only under extremely ambitious emissions reductions to net zero and beyond to net CO2 removal.
Reaching 2, 3 or even 4 degrees
The date at which the world will first reach a particular global warming level is determined by three factors:
The emissions pathway the world follows
The possibility of reaching of +2, +3 or even +4 °C levels, and the timing of reaching them are very strongly influenced by the emissions pathway (see graphs below).
The warming trend resulting from the emissions pathway
The amount of warming for a given increase in greenhouse gas concentration (known as climate sensitivity) is not precisely known, so this creates a range of possible dates a warming level is reached for a given emissions pathway.
The global climate variability around the warming trend
Climate variability not only affects when a warming level will be temporarily reached, such as the 12-month period over 1.5 °C we have recently experienced but processes of longer-term variability such as the Inter-decadal Pacific Oscillation (IPO) could also affect when the longer-term average reaches the warming level, by 5 years or more.
In reality, there is little chance that the world would plateau precisely at any particular warming level permanently. But even if it did, the regional climate would not instantly be at a new steady state.
Because the climate system has considerable inertia, some things take a while to reach a new steady state, or new ‘equilibrium’. Slower processes like sea level rise take hundreds of years to fully reach a new equilibrium, so the sea level will be lower in the first years of a +1.5 °C world compared to if the climate has stabilised at +1.5 °C for a long period. But global warming levels are a useful benchmark to assess climate change this century.
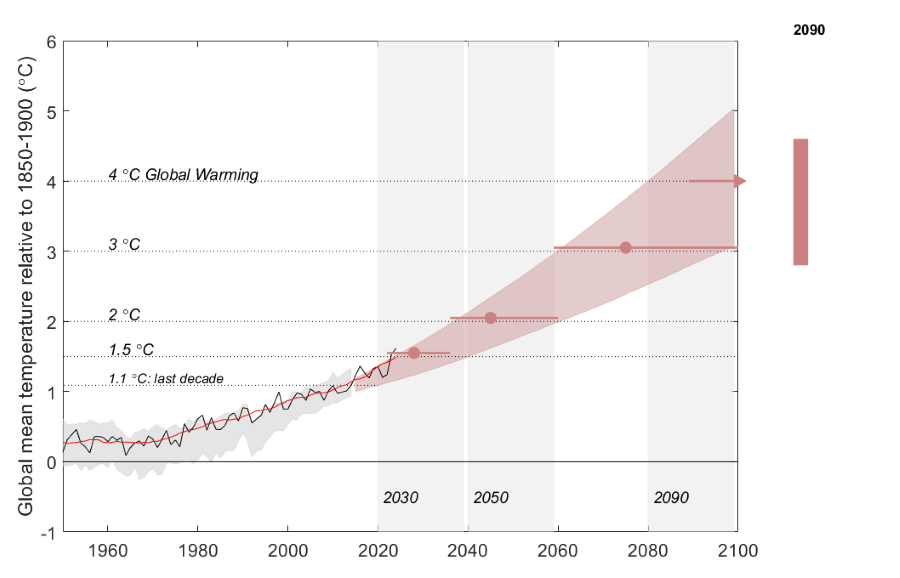
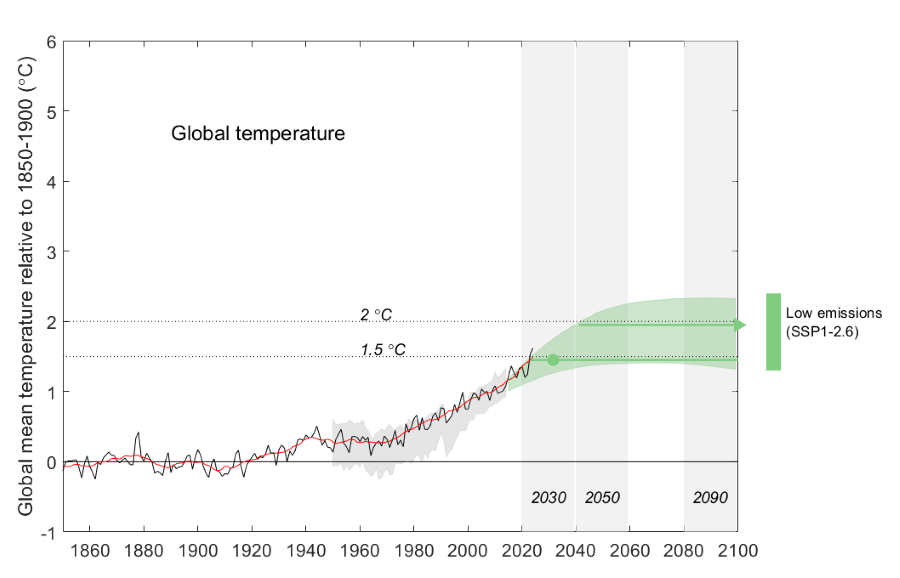
The IPCC Sixth Assessment Report produced estimated windows of reaching global warming levels, assessed from observations, various climate models, and our understanding of climate sensitivity. In the graphs below, these windows are represented visually for two commonly used , showing the time period where reaching the level is possible (lines) and the central estimate if it is present (circles):
| SSP1-2.6 | SSP3-7.0 | |
|---|---|---|
| 1.5 °C | Around 2030 (2023-2042) | Around 2030 |
| 2 °C | Not crossed (possible from 2050) | Around mid-century (2037-2056) |
| 3 °C | Not crossed | Mid-late century (2066-2085) |
| 4 °C | Not crossed | Not crossed (possible from 2070) |
Time windows we would be likely to reach each Global Warming Level under the two SSPs (as shown on plots, source: IPCC 2021)
High global emissions SSP3-7.0
Very low global emissions SSP1-2.6
Page last updated 1st Dec 2025