Climate Change in Australia
Climate information, projections, tools and data
Global trends
For many decades, palaeoclimatologists have examined how the Earth's temperature changed over the centuries before 1850.
From this work emerged a view of the past climate based on limited data from tree rings, historical documents, ice cores, sediments and other proxy data sources. Today, many more palaeoclimate records are available from around the world, providing a much improved view of past changes in the Earth's temperature.
The Earth’s temperature has fluctuated naturally over hundreds of millions of years. These past changes can help us understand the relationship between temperature, greenhouse gases and other climate drivers today.
Some of the clearest changes in temperature and atmospheric composition are recorded in ice cores over nearly 1 million years. The Earth has experienced cycles of ice ages separated by warm interglacial periods approximately every 100,000 years. These are primarily driven by regular “wobbles” in the Earth’s orbit, which affects the amount of solar radiation reaching the Earth. During the onset of interglacial periods, the warming takes about 5000 years to complete.
Significant warming begins in the Antarctic and several hundred years later the warming causes the carbon dioxide (CO2) increase, mainly through ocean processes. The Northern Hemisphere deglaciation follows the CO2 increase. Therefore, increases in CO2 contribute an amplification (positive feedback) throughout most of the warming. The ice sheets also cause a feedback. The observed temperature changes and rates of change during glacial-interglacial periods cannot be simulated without the observed changes in CO2 or ice extent.
The past 11, 000 years (the Holocene) is marked by much smaller global temperature changes, typically up to 1-1.5 oC. Greenhouse gas concentrations were also relatively stable until the large and rapid increases that began about 200 years ago as a result of anthropogenic (i.e. caused by humans) emissions. The concentration of CO2 is now higher than for at least the past 800,000 years.
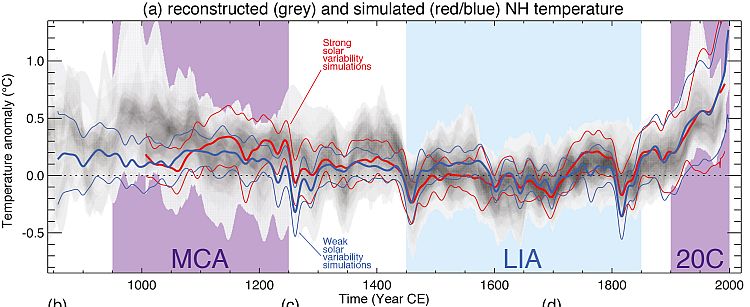
Although each proxy temperature record is different, they all indicate similar patterns of temperature variability over the last 500 to 2000 years. The terms Medieval Warm Period and Little Ice Age describe two past climate epochs in Europe and neighbouring regions. The Little Ice Age was a period of cooling that occurred after the Medieval Warm Period.
Thus, during the past millennia there have been lengthy periods of somewhat warmer and cooler conditions. Most striking is the fact that each proxy record reveals a steep increase in the rate or spatial extent of warming since the mid-19th to early 20th centuries. Records indicate the temperatures of the most recent decades are the warmest in the entire record (see figure).

Changes over the last millennium. Northern hemispheric temperatures reconstructed from proxy records are shown in grey. Red and blue show simulated temperatures. Periods shown include the Medieval Climate Anomaly (MCA), Little Ice Age (LIA) and the 20th century. SOURCE: IPCC 2013
The instrumental record indicates changes over the last century as summarised in the latest Intergovernmental Panel on Climate Change (IPCC) report:
- Warming of the climate system is unequivocal, and since the 1950s, many of the observed changes are unprecedented over decades to millennia. The atmosphere and ocean have warmed, the amounts of snow and ice have diminished, sea level has risen, and the concentrations of greenhouse gases have increased.
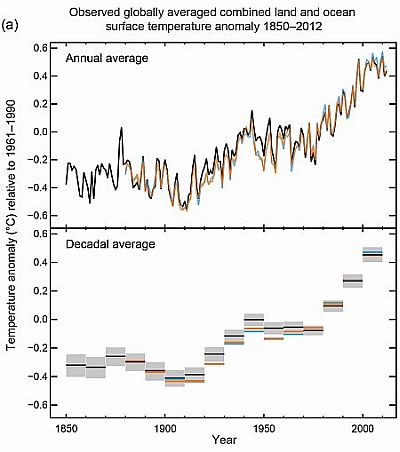
- Each of the last three decades has been successively warmer at the Earth’s surface than any preceding decade since 1850 (see Figure). In the Northern Hemisphere, 1983–2012 was likely the warmest 30-year period of the last 1400 years (medium confidence).
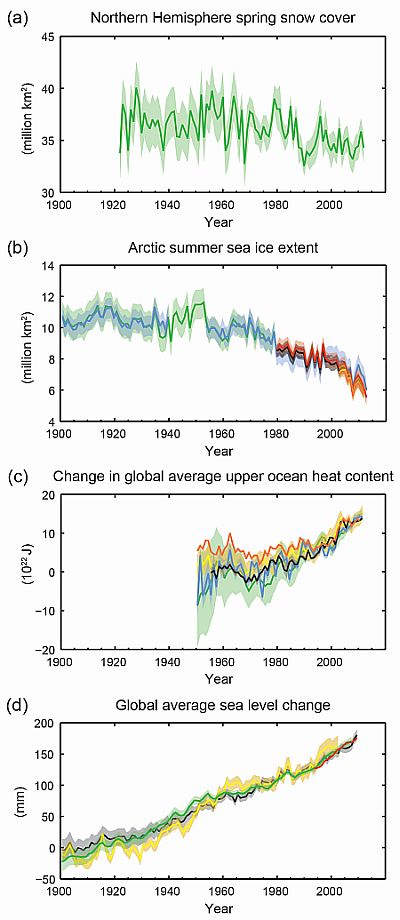
- Ocean warming dominates the increase in energy stored in the climate system, accounting for more than 90% of the energy accumulated between 1971 and 2010 (high confidence). It is virtually certain that the upper ocean (0−700 m) warmed from 1971 to 2010, and it likely warmed between the 1870s and 1971.
- Over the last two decades, the Greenland and Antarctic ice sheets have been losing mass, glaciers have continued to shrink almost worldwide, and Arctic sea ice and Northern Hemisphere spring snow cover have continued to decrease in extent (high confidence)
- The annual mean Arctic sea ice extent decreased over the period 1979 to 2012 with a rate that was very likely in the range 3.5 to 4.1% per decade. It is very likely that the annual mean Antarctic sea ice extent increased at a rate in the range of 1.2 to 1.8% per decade.
- The rate of sea level rise since the mid-19th century has been larger than the mean rate during the previous two millennia (high confidence). Over the period 1901 to 2010, global mean sea level rose by 0.19 [0.17 to 0.21] m.

a) Northern Hemisphere spring snow cover b) Arctic summer ice extent c) Change in global average upper ocean heat content d) Global average sea level change. SOURCE: IPCC 2013

Observed globally averaged combined land and ocean surface temperature anomaly 1850-2012. SOURCE: IPCC 2013
Page updated 17th December 2020


