Climate Change in Australia
Climate information, projections, tools and data
Australian climate trends
The Bureau of Meteorology and other science agencies employ a range of atmospheric, terrestrial and marine sensors to track climatic trends.
For example, the Australian Climate Observations Reference Network – Surface Air Temperature dataset is based on a network of over 100 stations, with data for more than half starting in 1910.
The following information is taken from the 2020 State of the Climate report, produced every two years by CSIRO and the Bureau of Meteorology.
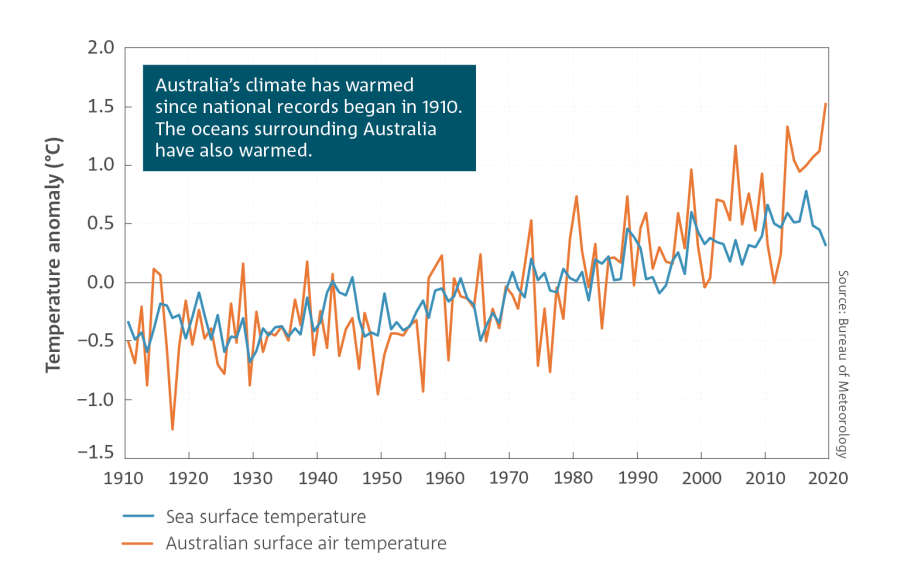
Australia’s climate has warmed since national records began in 1910, with most warming occurring since 1950. Australia's mean surface air temperature has increased by more than 1.4°C since 1910. Since 1950, every decade has been warmer than it's predecessor. Australia’s warmest year on record was 2019, and the seven years from 2013 to 2019 all rank in the nine warmest years. This long‑term warming trend means that most years are now warmer than almost any observed during the 20th century. When relatively cooler years do occur, it is because natural drivers that typically cool Australia’s climate, such as La Niña, act to partially offset the background warming trend.
Average sea surface temperature in the Australian region has warmed by more than 1 °C since 1900, with eight of the ten warmest years on record occurring since 2010. The warmest year on record was 2016, associated with one of the strongest negative Indian Ocean Dipole events on record.

Anomalies in annual mean sea surface temperature, and temperature over land, in the Australian region. Anomalies are the departures from the 1961–1990 standard averaging period. Sea surface temperature values (data source: ERSST v5, www.esrl.noaa.gov/psd/) are provided for a region around Australia (4–46 °S and 94–174 °E). ©Bureau of Meteorology
Warming is observed across Australia in all months with both day and night‑time temperatures increasing. This shift is accompanied by more extreme nationally averaged daily heat events across all months. For example, 2019 experienced 43 extremely warm days, more than triple the number in any of the years prior to 2000. This increasing trend is observed at locations across all of Australia.
The frequency of summer very hot days has increased compared to earlier
decades. For example, 2019 saw 33 days when national daily average
maximum temperature exceeded 39°C, more than the total number observed
from 1960 to 2018 (24 days).
Very high monthly maximum
temperatures that occurred nearly 2 per cent of the time in 1960–1989
and over 4 per cent of the time in 1990–2004, now occur over 12 per cent
of the time (2005–2019). This is more than a sixfold increase over the
sixty-year period. Very warm monthly night-time temperatures that
occurred nearly 2 per cent of the time in 1960–1989 and over 5 per cent
of the time in 1990–2004, now occur around 11 per cent of the time
(2005–2019).
This shift in extremes has many impacts on human
health, ecosystems and infrastructure and informs climate impact and
risk assessments.
The frequency of extremely cold days and nights
has declined across Australia. An exception to this is for extremely
cold nights in those parts of southeast and southwest Australia which
have seen significant cool season drying, and hence more clear winter
nights. The frequency of frost in these parts is relatively unchanged
since the 1980s.
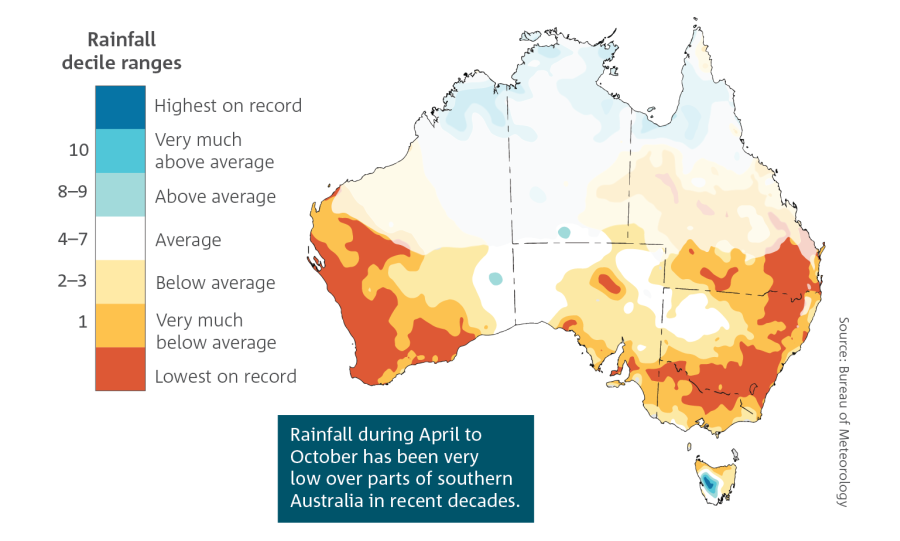
Australian rainfall is highly variable and is strongly influenced by drivers such as El Niño, La Niña, the Indian Ocean Dipole and the Southern Annular Mode. Despite this natural variability, long‑term trends are evident in Australia’s rainfall record. There has been a shift towards drier conditions across the southwest and southeast, with more frequent years of below average rainfall, especially for the cool season months of April to October. In 17 of the last 20 years, rainfall in southern Australia in these months has been below average. This is due to a combination of natural variability on decadal timescales and changes in large‑scale circulation caused by increased anthropogenic greenhouse gas emissions.
There has been a decline of around 16 per cent in April to October rainfall in the southwest of Australia since 1970. Across the same region May to July rainfall has seen the largest decrease, by around 20 per cent since 1970.
In the southeast of Australia there has been a decline of around 12 per cent in April to October rainfall since the late 1990s.
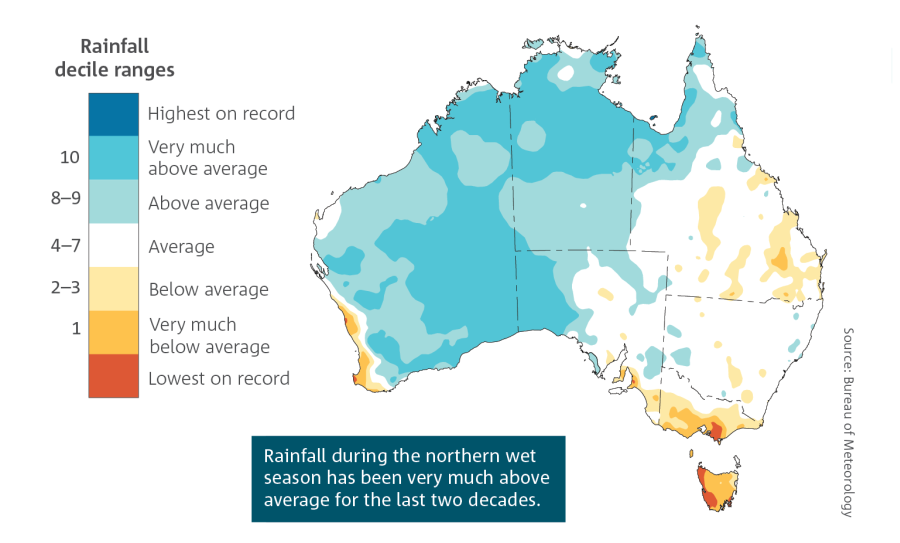
Rainfall has increased across most of northern Australia since the 1970s.

April to October rainfall deciles for the last 20 years (2000–19). A decile map shows where rainfall is above average, average or below average for the recent period, in comparison with the entire rainfall record from 1900. Areas across northern and central Australia that receive less than 40 per cent of their annual rainfall during April to October are faded. ©Bureau of Meteorology

Northern wet season (October–April) rainfall deciles for the last 20 years (2000–01 to 2019–20). A decile map shows where rainfall is above average, average or below average for the recent period, in comparison with the entire national rainfall record from 1900. ©Bureau of Meteorology
Heavy rainfall events are becoming more intense.
Observations show that there has been an increase in the intensity of heavy rainfall events in Australia. The intensity of short-duration (hourly) extreme rainfall events has increased by around 10 per cent or more in some regions and in recent decades, with larger increases typically observed in the north of the country. Short-duration extreme rainfall events are often associated with flash flooding, and so these changes in intensity bring increased risk to communities. This is particularly so in urban environments where the large amount of impervious ground cover (e.g. concrete) leads to increased flooding during heavy downpours.
Heavy rainfall events are typically caused by weather systems such as thunderstorms, cyclones and east coast lows. Daily rainfall totals associated with thunderstorms have increased since 1979, particularly in northern Australia. This is due to an increase in the intensity of rainfall per storm, rather than an increase in the number of storms in general.
The frequency of the most dangerous 10 per cent of fire weather days has increased significantly in recent decades across many regions of Australia, especially in the south and east. These increases are particularly evident during spring and summer and are associated with an earlier start to the southern fire weather season.
Downward trends in maximum snow depth have been observed for Australian alpine regions since the late 1950s, with the largest declines during spring and at lower altitudes. Downward trends in the temporal and spatial extent of snow cover and the number of snowfall days are also observed.
Snow depth is closely related to temperature, and the observed declines are associated with the observed warming trends. Maximum snow depth remains highly variable and is strongly influenced by rare heavy snowfall days, which have no observed trends in frequency. Several heavy snowfall events contributed to average to high maximum snow depths in the seasons from 2017 to 2019.
More information about observed trends and attribution for temperature, rainfall, floods, droughts, fire weather, cyclones, east coast lows, hail and sea level can be found in the CMSI climate science guidance at https://www.cmsi.org.au/reports .
Global mean sea level increased throughout the 20th century and has risen by 250 mm since 1880. Half of this rise has occurred since 1970. Rates of sea-level rise vary around the Australian region, with higher sea-level rise observed in the north and southeast.
Further information (external links)
State of the Climate > CSIRO and the Bureau of Meteorology Recent Australian climate statements > Bureau of Meteorology Climate and past weather > Bureau of MeteorologyPage updated 16th December 2020


