Climate Change in Australia
Climate information, projections, tools and data
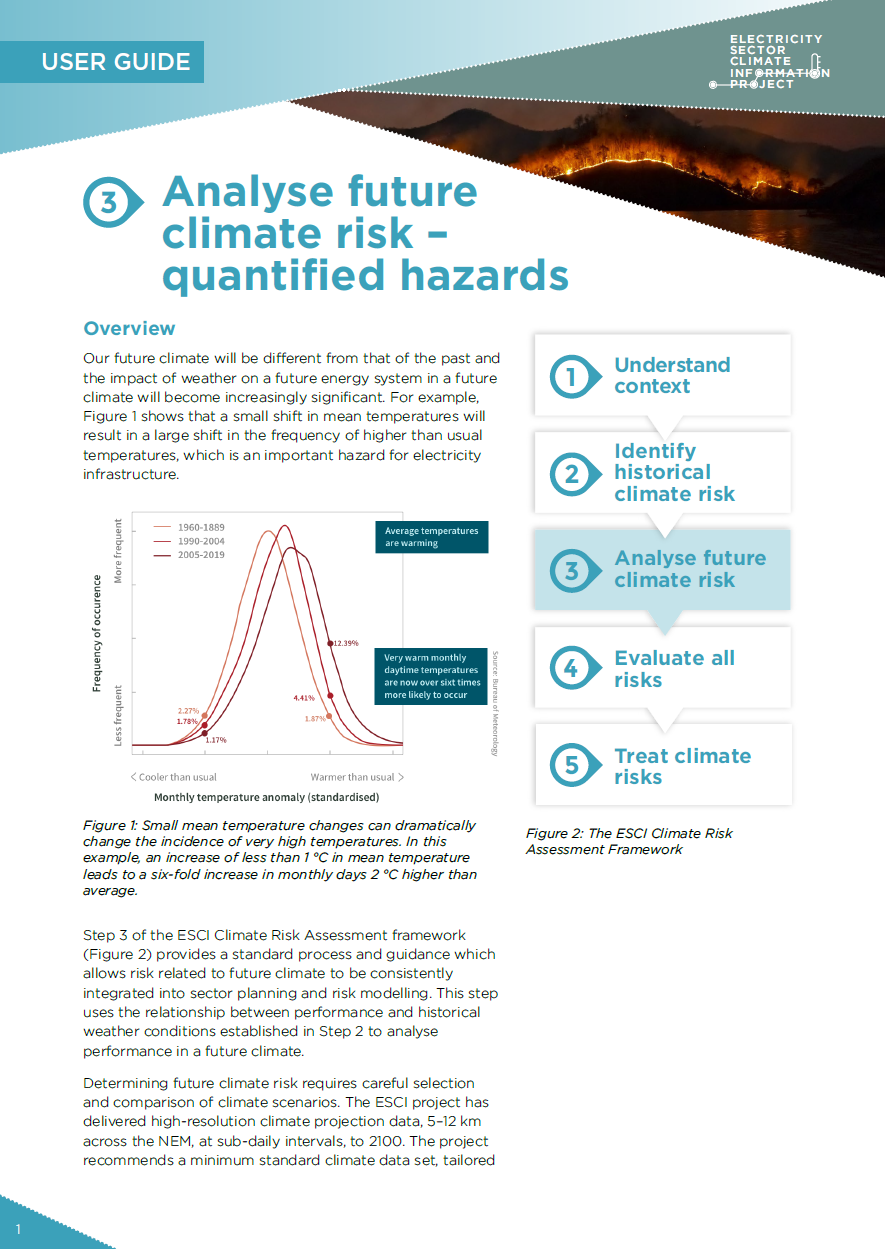
Step 3.1: Analyse Future Climate Risk (quantified)
Guidance Step 3.1
(pdf 1.2 MB)
- Defining the Scope
- Conducting a Climate Risk Analysis
- Choosing RCPs
- Climate Models and Downscaling
- Climate Information Products For Use in Risk Assessments
- Understanding Confidence and Uncertainty in Climate Projections
- Conclusion
- References
- Downloads
Choosing appropriate climate data for quantitative analysis
Future climate risk can be assessed using the model developed in Step 2 which captures the historical relationship between weather/climate and asset/system performance. This model can use projected climate data as an input to estimate future asset/system performance.
The ESCI project has delivered high-resolution climate projection data, 5–12 km across the National Electricity Market (NEM), at sub-daily intervals, to 2100. The project recommends a minimum standard climate data set, tailored for the electricity sector, that can be used for most risk assessments. The use of standard data allows comparison of risk assessments across the sector for investment decisions and system-wide risk assessments and captures uncertainty in the future climate. The recommendation is not intended to be restrictive but facilitates efficient production of reliable information.
DEFINING THE SCOPE
Choosing appropriate climate information for the risk analysis depends on a number of parameters—some of which were considered in Step 2:
- What is the key hazard? Is the historical performance dominated by a single hazard (e.g. high temperature) or multiple hazards (e.g. power line transmission ratings are affected by both wind and temperature)?
- Are thresholds more important or is the range of variance important? Thresholds could include, for example, performance above 45 oC, or engineering built to withstand 1 in 100-year events. Variance can be explored with time series, available as daily, monthly, annual or sub-daily data.
- What time frame is important? This is likely to be guided by the lifetime of the asset (e.g. next 20 years or next 50 years).
- What greenhouse gas emissions pathway is most relevant? This will depend to some extent on the purpose of the risk analysis. The project recommends scenario analysis using at least two pathways.
These questions can be used to select appropriate climate data through the ESCI website (Figure 1).3
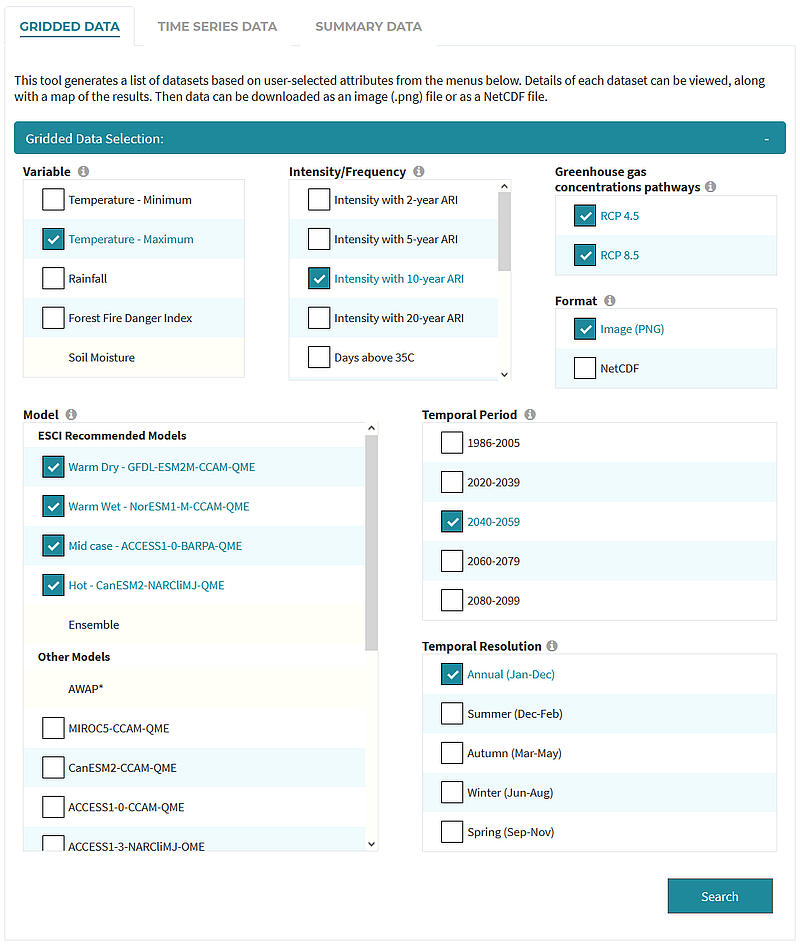
Figure 1 The ESCI Climate Data portal allows users to select a range of climate information. The most appropriate climate information depends on the scope of the analysis and outcomes of Step 2 in the ESCI Climate Risk Assessment Framework.
CONDUCTING A CLIMATE RISK ANALYSIS
Climate projections are, by definition, uncertain therefore the ESCI project recommends two ways of expressing uncertainty: (i) using different climate scenarios; (ii) using a collection ('ensemble') of climate models. These two methods can be combined (Figure 2 shows an analysis using three climate scenarios and four climate models).
Using climate scenario analysis
The Intergovernmental Panel on Climate Change (IPCC) describes changes in the future climate using 'representation concentration pathways' (RCPs) for greenhouse gas emissions.4 Climate scenarios are derived from climate model simulations driven by representative concentration pathways and provide information about projected changes in variables such as temperature, rainfall and windspeed. Figure 2 shows a climate risk analysis of the impact of future temperature trends on transmission line ratings5 using RCP2.6, RCP4.5 and RCP8.5.
, and a 500kV, 120 °C line (right) in New South Wales under three climate scenarios (RCP2.6, RCP4.5 and RCP8.5) using four climate models for each scenario. (Source: ESCI Case Study: The impact of extreme temperatures on transmission line ratings)")
Figure 2. Projected de-ratings for a 330kV, 85 °C line (left), and a 500kV, 120 °C line (right) in New South Wales under three climate scenarios (RCP2.6, RCP4.5 and RCP8.5) using four climate models for each scenario. (Source: ESCI Case Study: The impact of extreme temperatures on transmission line ratings)
Using an ensemble of climate models
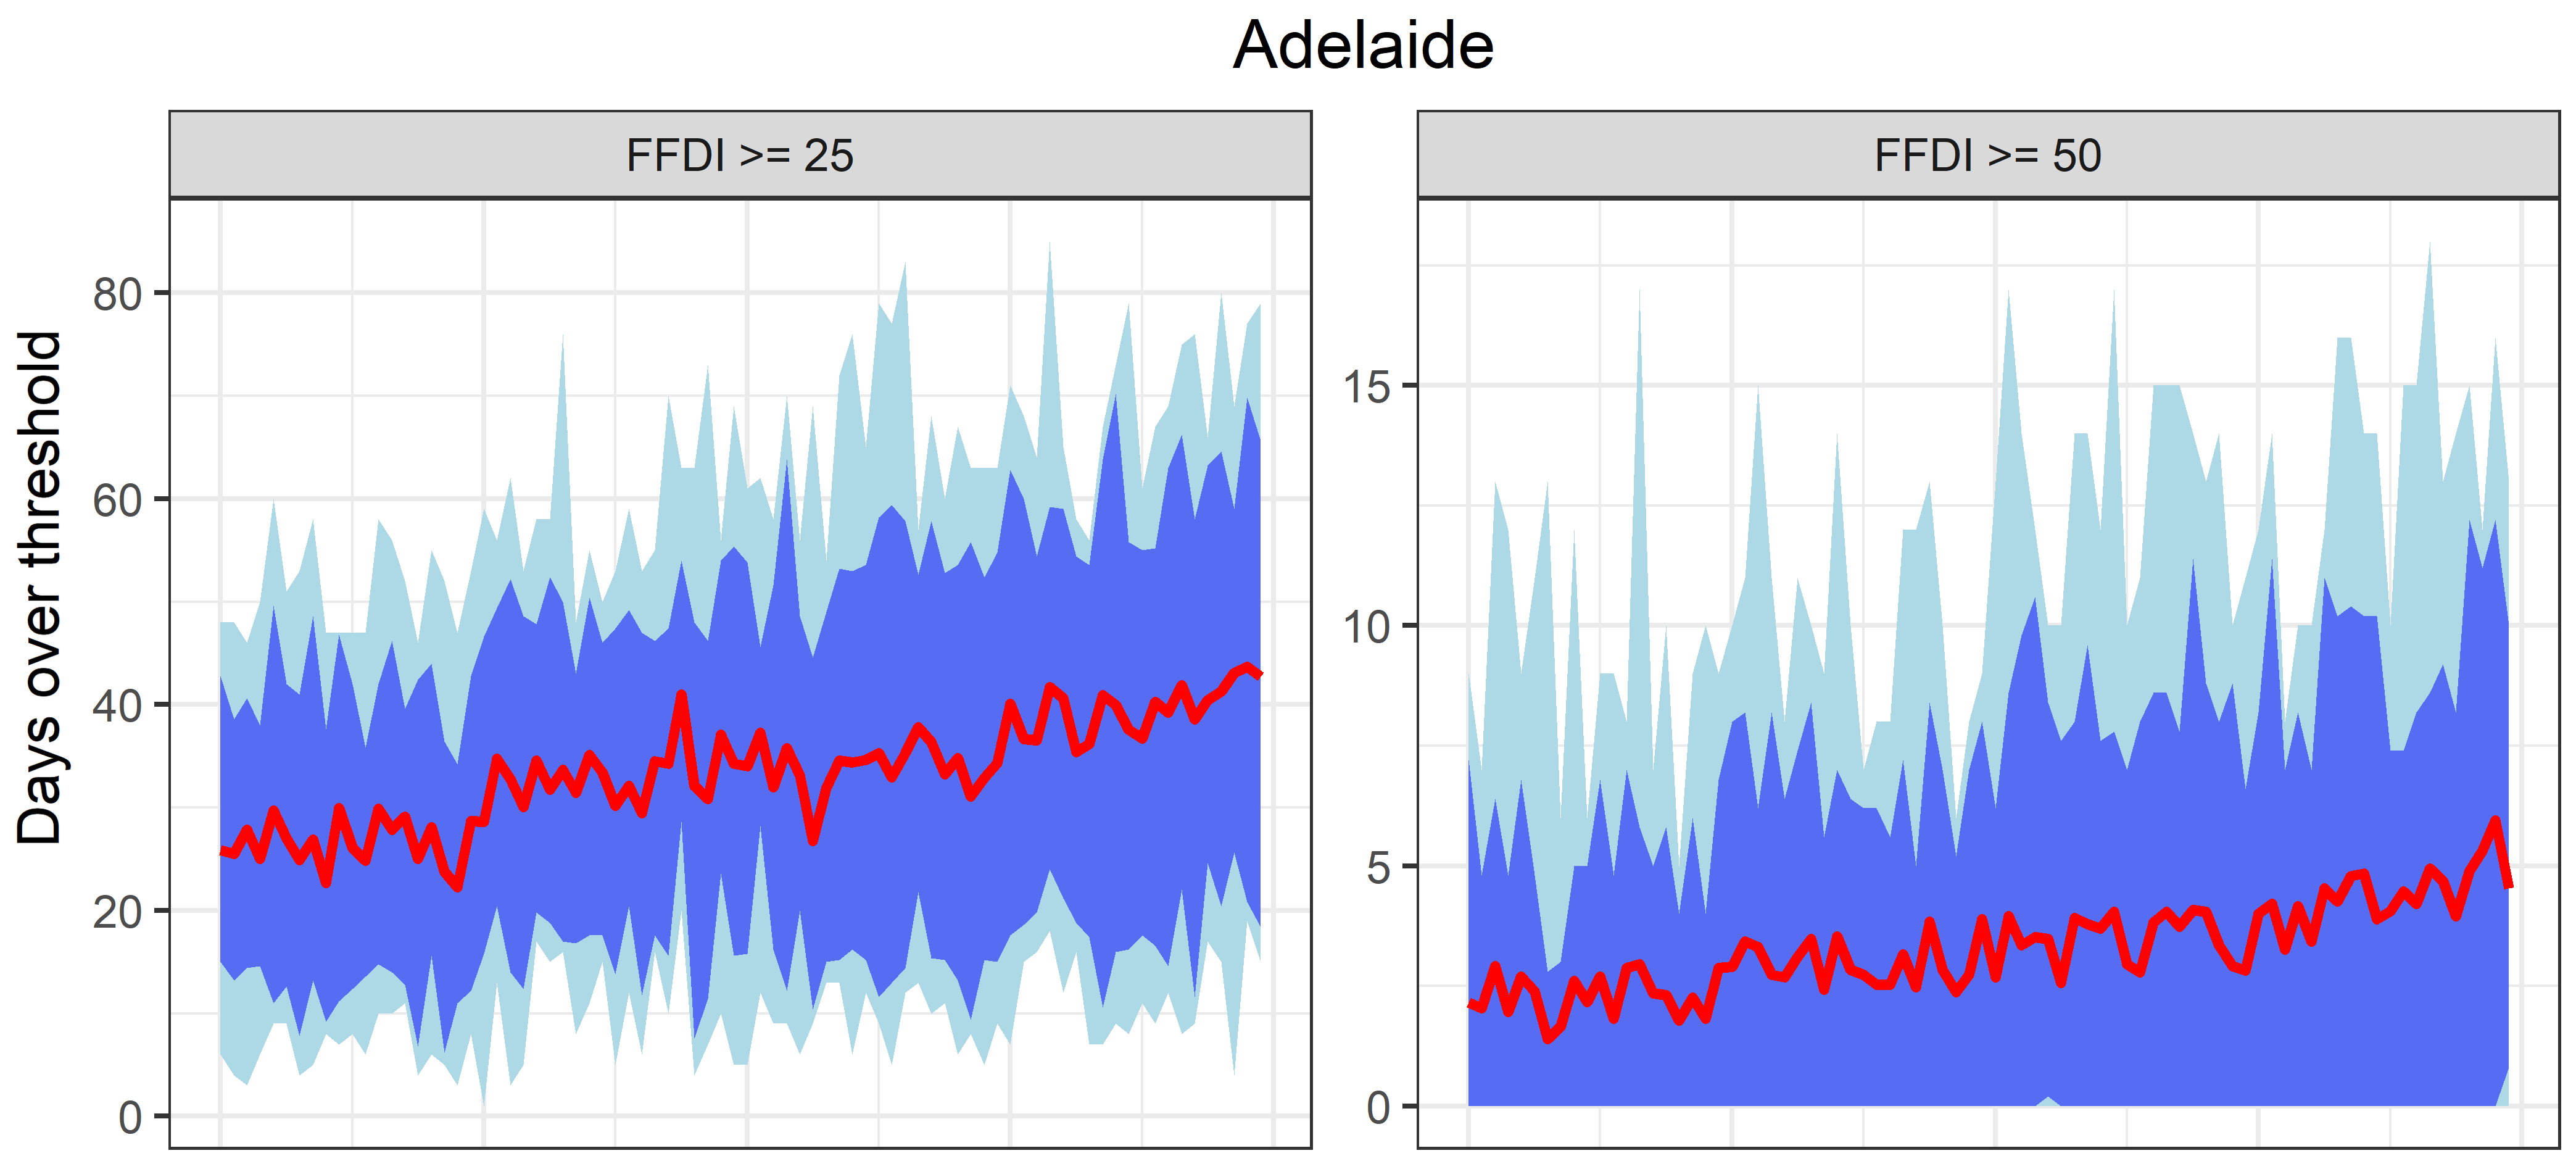
Figure 3 Time-series of days per year when the forest fire danger index is over 25 ('very high fire danger') and 50 ('severe fire danger') for Adelaide, projected from 2020 to 2100. (Source: ) These plots combine the time-series from eight different climate models, using RCP8.5, with the light blue showing the range for all models, the dark blue showing the range for 80% of the models and the red line showing the median value.
Climate data tailored to electricity sector needs are available on this (ESCI) portal. Additional or alternative climate information can be accessed from a number of sources, the most credible and comprehensive being the Climate Change in Australia website (which houses this ESCI portal).6 Other relevant information sources include the CMSI climate science guidance and the NESP Earth Systems and Climate Change Hub.
More information on choosing future climate scenarios and climate data sets for the analysis is presented below.
CHOOSING RCPS
Representative concentration pathways are plausible future scenarios but are not predictions; they depend on a range of assumptions about contributions to climate change. For example, will we continue to burn fossil fuels at an ever-increasing rate, or will we continue shifting towards renewable energy?
The four most commonly used RCPs range from very high (RCP8.5) through to very low (RCP2.6) future greenhouse gas concentrations.7
Table 1 provides guidance for how to match the selection of the RCP to the purpose of the risk assessment. The ESCI project recommends that a climate risk analysis should use two pathways: RCP4.5, a moderate pathway, and RCP 8.5, a very high pathway.
Purpose of risk assessment | Timeframe and RCP |
|---|---|
Physical risk assessment as part of a financial reporting requirement |
TCFD8 recommends using scenarios that give a global warming of 2 °C and 4 °C by the year 2100. The CMSI guidance recommends using RCP2.6 for a 2 °C warming scenario and RCP8.5 for a 4 °C warming scenario.* However, RCP4.5 has a 40% chance of keeping global warming below 2 °C by 2100 so it is also worth considering. |
Stress-testing the performance of an asset or system or process in a future climate |
Consider the greatest plausible changes for the key hazards, which are likely to be provided by using RCP 8.5. (The ESCI case study on extreme compound events can also provide stress-testing scenarios.) |
Assessing the likely range of performance of a future investment** |
A range of RCPs and climate models should be used to assess asset or system performance. ESCI provides recommendations on ‘worst/best case’ scenarios to use in these risk assessments.9 |
An exploration of the system performance under different AEMO ISP scenarios (see sidebar) |
The AEMO ISP provides scenarios for the next 20 years,10 each of which is associated with a different RCP*. For example, the 2021 IASR 'Central' scenario is associated with RCP4.5, the 'diversified technology' scenario is associated with RCP2.6 and the 'slow growth' scenario is associated with RCP6.0. |
Notes
*The differences in RCPs and global warming are small up to 2040, with the differences becoming more important from 2050.
**Climate variability over the next 1–10 years is strongly influenced by natural variability;11 climate models have limited predictive skill over this period so historical risk can be a good guide.
CLIMATE MODELS AND DOWNSCALING
Global climate models (GCMs) are rigorous, complex and well-tested representations of physical processes in the climate system. The models run on supercomputers that provide solutions for multiple variables, timescales and regions. The models are constantly being updated as the science of climate change advances. There are 40 CMIP5 climate models accepted by the IPCC as authoritative. The ESCI project uses six of these12 that perform well in the Australian region.
GCMs have coarse spatial resolution (about 100–150 km between data points), which limits their ability to simulate small-scale processes including extreme weather events. The GCMs can be downscaled13 using high-resolution regional climate models that may provide additional insights and the potential for better information about extreme weather events.
The ESCI project generated 16 data sets from the GCMs using regional climate models (RCMs): the cubic conformal atmospheric model (CCAM, developed by CSIRO); the Bureau of Meteorology Atmospheric high-Resolution Projections for Australia (BARPA); and NARCliM (NSW and ACT Regional Climate Modelling) developed by a NSW Government partnership. The data sets are augmented by a tailored post-processing technique called quantile matching for extremes (Dowdy 2020), which produces data sets that are ‘application-ready’ (free of bias compared to observations and available on a 5-km grid) and appropriate for the analysis of changes to averages as well as climate extremes at the daily timescale.
The ESCI project recommends using a minimum of four data sets which can be considered representative of four climate futures, described by general terms like hot, wet, dry, warm (Table 2). Depending on the region of interest, stakeholders can choose data sets that represent the range of possible future climate scenarios.
Read more...
No. | Global climate model | Downscaling model | Northern Australia | Southern Australia | Eastern Australia | Inland (Rangelands) |
|---|---|---|---|---|---|---|
1 | GFDL-ESM2M | CCAM | Warm, Dry | Warm, Dry | Warm, Dry | Warm, Dry |
2 | CanESM2 | NARCliM-j | Hot | Warm | Hot | Hot |
3 | ACCESS-1.0 | BARPA | Mid case | Mid case | Mid case | Mid case |
4 | NorESM1-M | CCAM | Warm, wet | Mid case | Warm, wet | Warm, wet |
The four recommended projections can be seen in relation to the wider range of 40 GCMs in scatterplots of temperature and rainfall change (Figure 4b). The four models don’t span the entire range in every case; a subset of just four models can’t achieve this. These recommended data sets provide a minimum standard that can be used in most risk assessments, enabling consistency and comparability.14 They are relevant to the electricity sector and are scientifically credible.9

Figure 4a Map showing the climate regions used in Figure 4b.
The four recommended projections can be seen in relation to the wider range of 40 GCMs in scatterplots of temperature and rainfall change (Figure 4b). The four models don’t span the entire range in every case; a subset of just four models can’t achieve this. These recommended data sets provide a minimum standard that can be used in most risk assessments, enabling consistency and comparability.16 They are relevant to the electricity sector and are scientifically credible.17
Data for other climate models, including high-resolution regional downscaling, are provided via the ESCI website and can be used to supplement the recommended minimum data sets. It is always good to use as many of the model outputs as is practical, since using more models and data sets explores more of the plausible ‘uncertainty space’ in climate change.
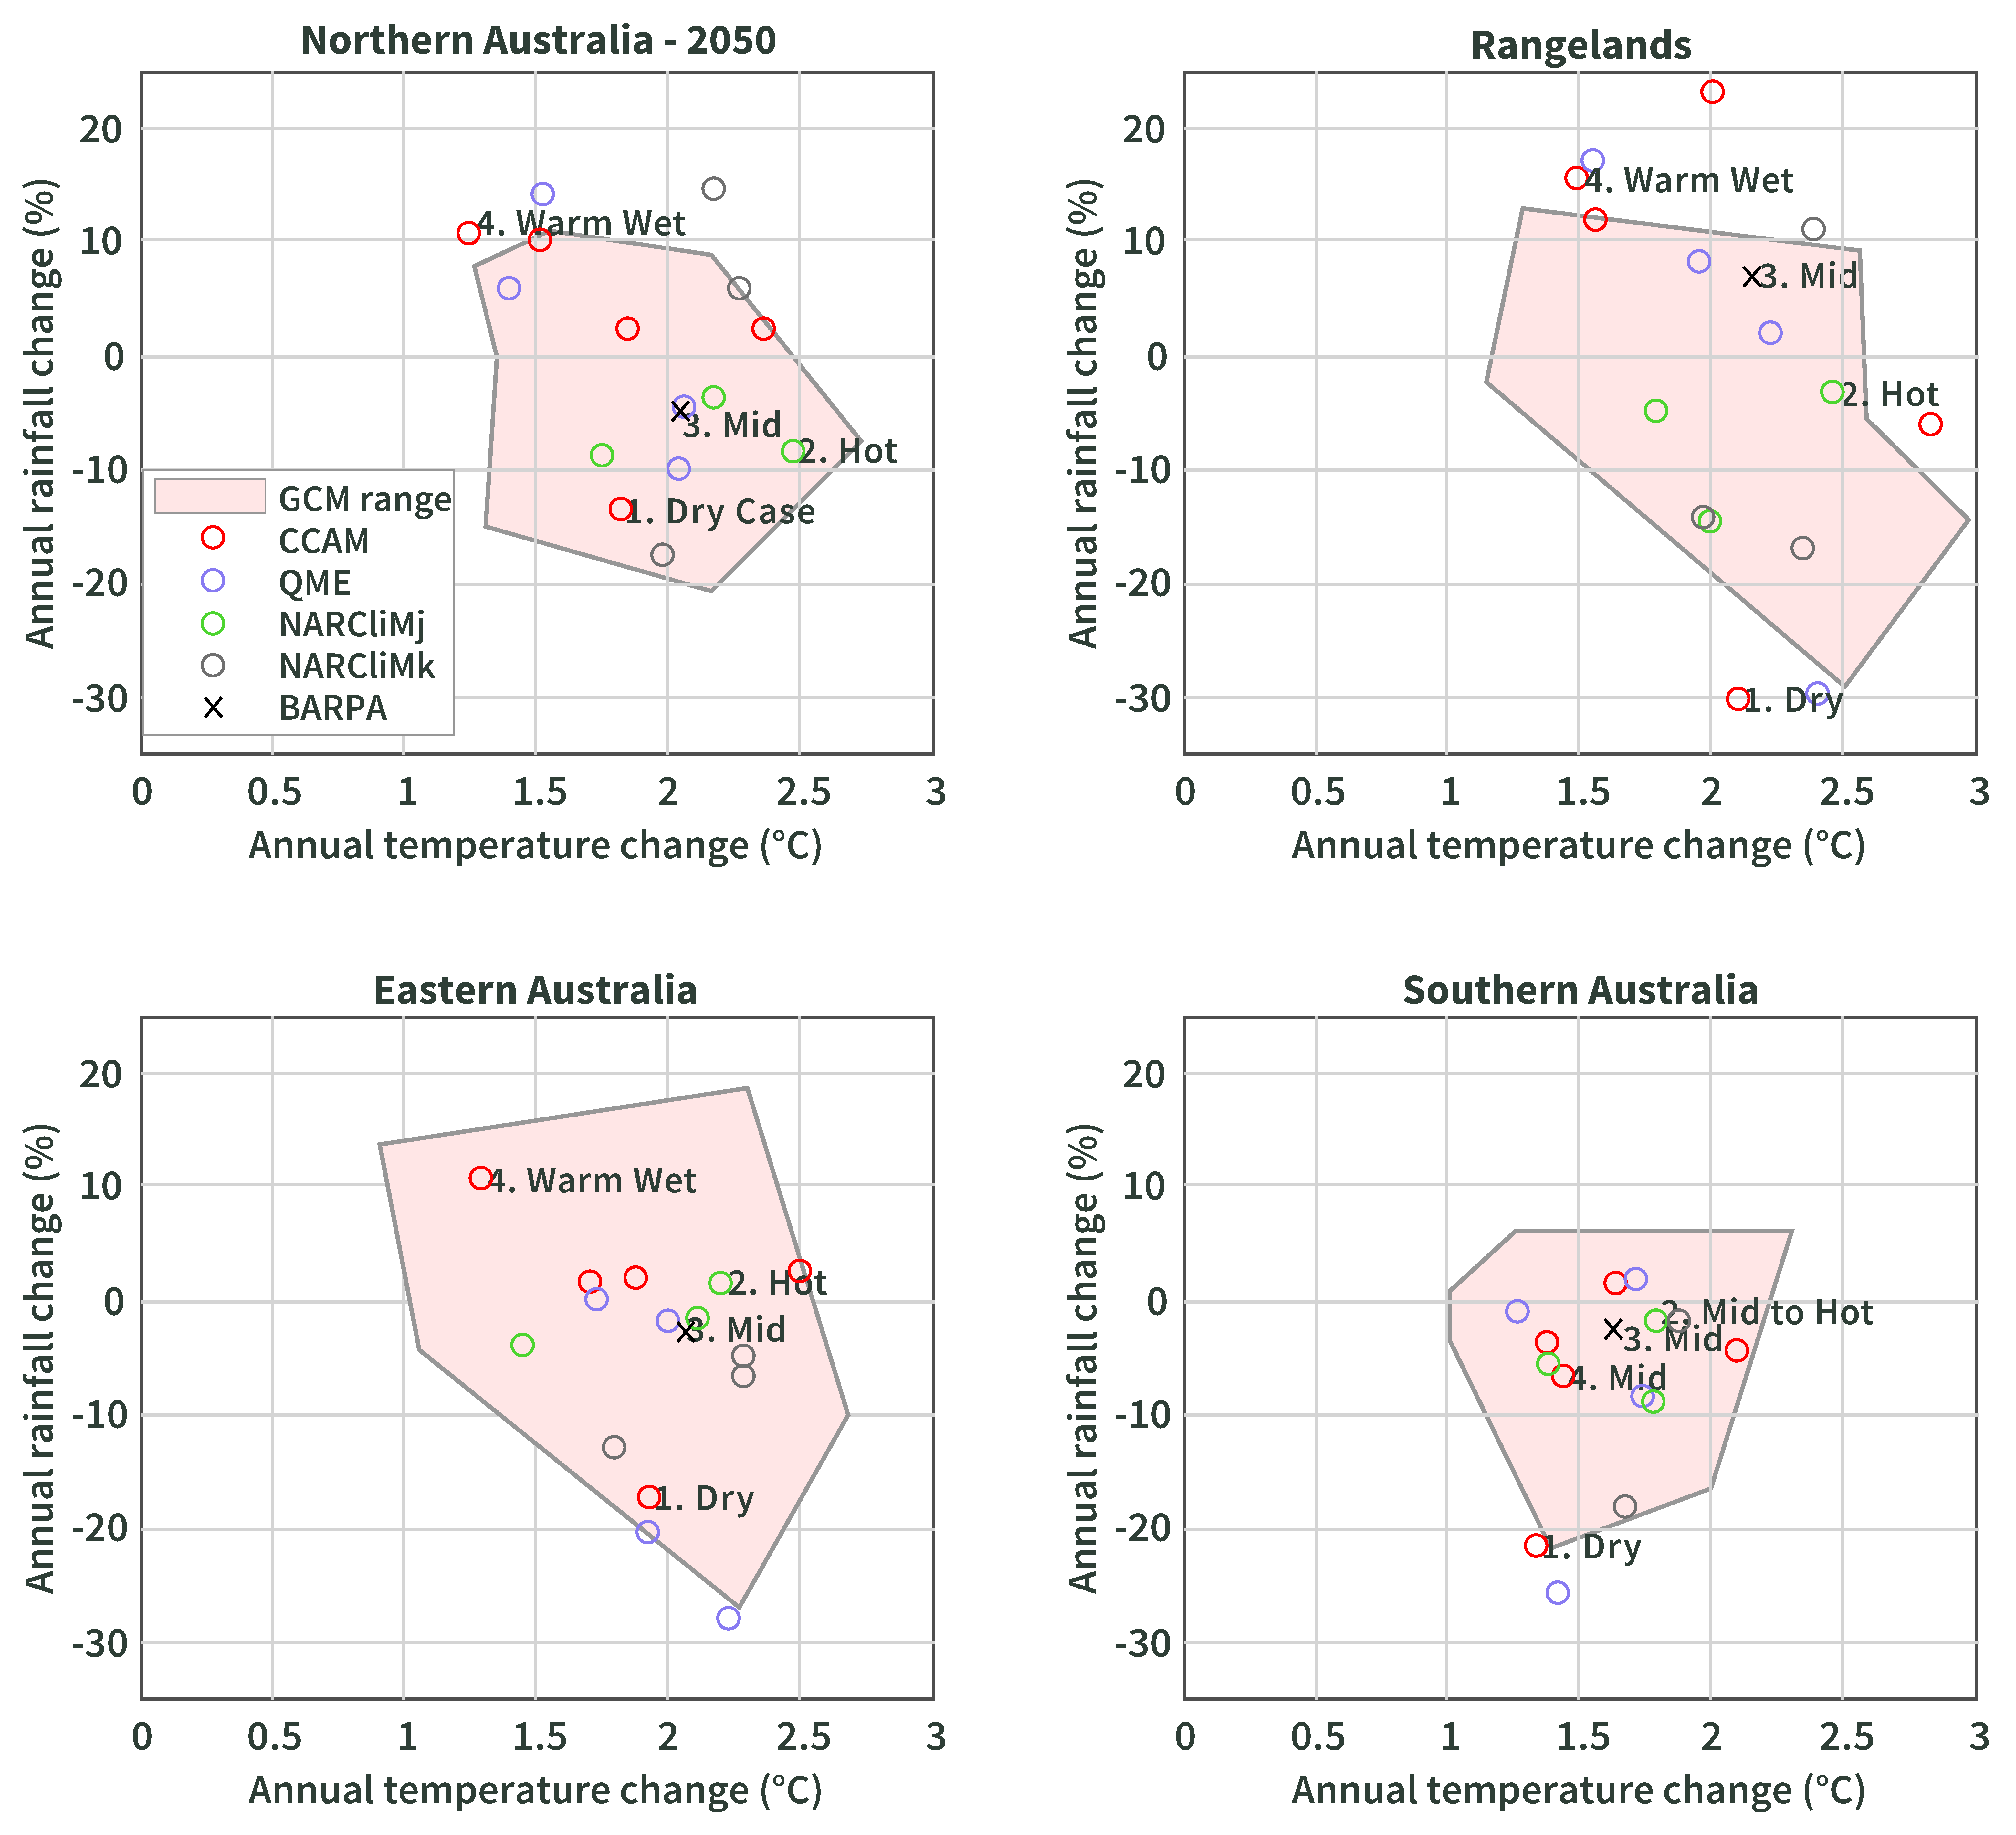
Figure 4b Projected change in annual temperature and rainfall between 1986–2005 and 2040–2059 under very high emissions pathway (RCP8.5) for four broad regions of Australia shown in Figure 4a. The polygon shows the range simulated by 40 CMIP5 GCMs as reported in Climate Change in Australia (CSIRO and BoM 2015), and the markers show the 16 ESCI projections, differentiated by symbol. The recommended data sets are numbered 1–4.
CLIMATE INFORMATION PRODUCTS FOR USE IN RISK ASSESSMENTS
The ESCI project provides a range of climate information that can be used for different risk assessments.
Gridded data
Extreme weather events can be analysed by frequency or intensity. Intensity can be displayed as maps of events with 2-, 5-, 10- or 20-year average recurrence intervals (ARI).15 Frequency can be displayed as maps of the number of days per year exceeding specified thresholds (e.g. days over 40 oC). Data are available on a 5-km grid. Frequency and intensity maps are provided both from single models, for use when comparing multiple variables, and from an ensemble of all available model simulations;16 for use in comparing extreme values of single hazards such as extreme temperature or rainfall.17
Figure 5 shows examples of 1-in-20-year ARI maps for maximum temperature in 2050 and 2070 for RCP8.5. A similar map can be produced from the same model for rainfall and for bushfire weather.18
 for 20-year time-slices centred on 2050 (left) and 2070 (right). The data are from the CanESM2-CCAM-QME data set derived using RCP 8.5. Brown represents temperatures higher than 50 °C.")
Figure 5. One-in-twenty-year maximum temperatures for the summer months (Dec–Feb) for 20-year time-slices centred on 2050 (left) and 2070 (right). The data are from the CanESM2-CCAM-QME data set derived using RCP 8.5. Brown represents temperatures higher than 50 °C.
Gridded data for severe convective windspeed includes only current climate, as projections for future climate are highly uncertain, but ESCI research has provided significant new insight on the climatology of this hazard (Brown and Dowdy 2021).19
Time-series
The ESCI website provides simulated weather time series (from sub-daily to annual intervals) from 1980 to 2099 at 168 locations across the National Electricity Market, with a focus on urban centres, major transmission routes and renewable energy zones. Historical weather data from the Bureau of Meteorology are also available for 1980–2020. The historical weather data should be used in Step 2 to establish a relationship between weather and asset/system performance. Simulated weather data for 1980–2020 have similar statistical properties but the sequence of weather events is different.
Summary tables
Summary statistics have been tabulated for selected climate variables, seasons, 20-year periods, RCPs and locations. These tables can provide a quick reference to the scale of expected change and can be displayed and downloaded in Excel format from the ESCI website.
UNDERSTANDING CONFIDENCE AND UNCERTAINTY IN CLIMATE PROJECTIONS
There are three main sources of uncertainty in climate projections:20
- Natural climate variability. This includes internal variability in daily weather, seasonal–annual climate (e.g. El Niño and La Niña), and decadal climate (e.g. Pacific Decadal Oscillation). This is the dominant source of uncertainty over the next 1–10 years.
- How regional weather and climate respond to changing greenhouse gas and aerosols concentrations. This information is derived from climate models, each of which provides a different simulation of future weather and climate at a given location.
- How greenhouse gas and aerosol concentrations may change in response to socio-economic change, technological change, energy transitions, and land-use change. This is described using representative concentration pathways (see Choosing RCPs, above). This is the largest source of long-term uncertainty.
Confidence in the validity of the climate projection for any single variable is based on the type, amount, quality and extent of agreement of different lines of evidence for future climate information (this includes climate process understanding, theory, published data, models and expert judgment).21 Confidence is expressed qualitatively as very low, low, medium, high or very high. Where there is limited evidence with low agreement, confidence is low. Where evidence is robust with high agreement, confidence is high.
The ESCI project provides a rigorous assessment of confidence in projections for key climate hazards (summarised in Table 3).
Hazard | Confidence |
|---|---|
Increases in average and extreme temperature | Very high |
Decreases in winter and spring rainfall in southern Australia | High |
Winter rainfall decreases in the east | Medium |
Increase in extreme daily rainfall | Medium |
CONCLUSION
The ESCI project has delivered high-resolution climate projection data (5–12 km across the NEM, at sub-daily to daily intervals, to 2100). It has also tailored guidance and insights to enable the electricity sector to select appropriate data to assess climate risks and to plan for the future with greater confidence. The steps in the ESCI Climate Risk Assessment Framework, with the information available through the Climate Change in Australia website, allow climate risk to be integrated consistently into sector planning and risk modelling.
REFERENCES
See the Glossary for terms used in this and other modules
Brown A and Dowdy A (2021). Severe convection-related winds in Australia and their associated environments. Journal of Southern Hemisphere Earth Systems Science 71(1), 30–52. https://doi.org/10.1071/ES19052
CSIRO and Bureau of Meteorology (2015). Climate Change in Australia Information for Australia’s Natural Resource Management Regions: Technical Report , CSIRO and Bureau of Meteorology, Australia.
Di Virgilio G, Evans JP, Di Luca A, et al. (2020). 'Realised added value in dynamical downscaling of Australian climate change' Climate Dynamics 54:4675 https://doi.org/10.1038/s41558-020-00984-6
Fiedler T, Pitman AJ, Mackenzie, et al. (2021). 'Business risk and the emergence of climate analytics' Nature Climate Change 11:87–94 https://doi.org/10.1038/s41558-020-00984-6
Notes
1 For example, in the analysis of extreme winds; see ESCI case study and technical report on severe convective wind risk.
2 For example, see ESCI case study on extreme weather & the power system , also the technical report on decision-making using extreme/compound event case studies.
3 In some cases the most appropriate information can be found in the broader Climate Change in Australia (CCiA) website. Data on the ESCI portal have been tailored so that they are more likely to address electricity sector questions: see key concepts —ESCI recommended data sets—testing and validation.
4 Covered in detail in the ESCI key concepts —Choosing representative emissions pathways. The pathway number represents the 'radiative forcing' or warming potential of the greenhouse gas concentration in watts per square metre.
5 See ESCI case study—Extreme heat & transmission
6 See ESCI key concepts —Using CCiA to Choose Alternative Climate Information.
7 The ESCI project provides data sets for RCP4.5 and RCP8.5. However, a simple scaling approach can be used to adjust these data sets to provide data for an RCP2.6 scenario. See ESCI Key Concepts —scaling data sets for RCP 2.6.
8 TCFD (2017) The use of scenario analysis in disclosure of climate-related risks and opportunities (PDF download)
9 See ESCI Key concepts —ESCI recommended data sets—testing and validation.
10 AEMO Draft 2021 Inputs, Assumptions and Scenarios Report
11 See ESCI key concepts —Climate projection confidence and uncertainty.
12 Downscaling is also provided for Access1.3 using NARCliM.
13 Downscaling may not always add value and has important limitations—for more information, refer to ESCI Key concepts : climate models and downscaling (also Virgilio 2020 and Fiedler et al. 2021 ).
14 Suggested additional cases for Southern Australia are ACCESS-1.0-NARCLIMk-QME (dry future) and CanESM2-CCAM-QME (hot future), also available through the ESCI portal.
15 See ESCI key concepts —Deriving average recurrence interval (ARI) maps.
16 Technically, for an ensemble of climate models these are not maps but are visualisations of a statistical surface where each grid-cell is calculated separately so the data on the extremes for each cell may come from different climate models. Relative risk cannot be assessed from one cell to the next—time-series at relevant locations should be used to compare asset risk by location.
17 Average recurrence interval gridded data constructed from an ensemble of climate projections provides more stable information on extreme hazards but should only be used for single variable problems—see Section 2—and may be biased towards extremes.
18 Gridded data are available as images (PNG format) or netCDF files. NetCDF format files are very large files which can be viewed using GIS software and which include information on all relevant climate variables so that the different climate variables can be viewed as layers.
19 See ESCI case study on severe convective wind risk .
20 ESCI key concepts —Climate projection confidence and uncertainty includes a table quantifying the ranges of uncertainty and confidence ratings for selected climate variables, 20-year periods, RCPs and regions.
21 The ESCI technical report on the standardised methodology for projections likelihood describes the science behind the confidence and likelihood projections and expert assessment for three key hazards: rising temperatures, bushfire risk and severe convective winds.
Downloads
DownloadGuidance Step 3.1 and all figures (zip 1.9 MB)