Climate Change in Australia
Climate information, projections, tools and data
Methods
How can we assess Australian climate change at each warming level?
For general context, when looking at projections and impact assessments it is possible to use a rough rule of thumb to convert between Shared Socioeconomic Pathways (SSPs) and global warming levels. For example, global warming under high scenarios reaches 2 °C GWL by roughly mid-century. This is less precise than using more formal methods, but it is useful to assess and interpret existing results reported for SSPs or even RCPs into a Global Warming Levels lens. See Reaching Global Warming Levels for more.
To produce quantitative projections, it is important to use methods of estimating climate change at warming levels that are reliable and consistent with international good practice. There are various methods to estimate climate change at different global warming levels, see James et al. (2017) for a summary of many of them.
The main method used here is 'Time Sampling': using model simulations run for the emissions pathways and finding when in time they are simulating a world at the given global warming level. The results for regional climate change are extracted for those years and the difference to a baseline is calculated. Here we use a standard 20-year window centred on the year that the 20-year centred running average reaches warming level. This is consistent with the IPCC Sixth Assessment, and data of time windows from all model simulations is available in a central repository . The method is illustrated by the time window for 2 °C GWL in two example models in the figures below – the same approach is used for 1.5 and 3°C, and also for the recent 1.2°C GWL if that is used as a baseline.
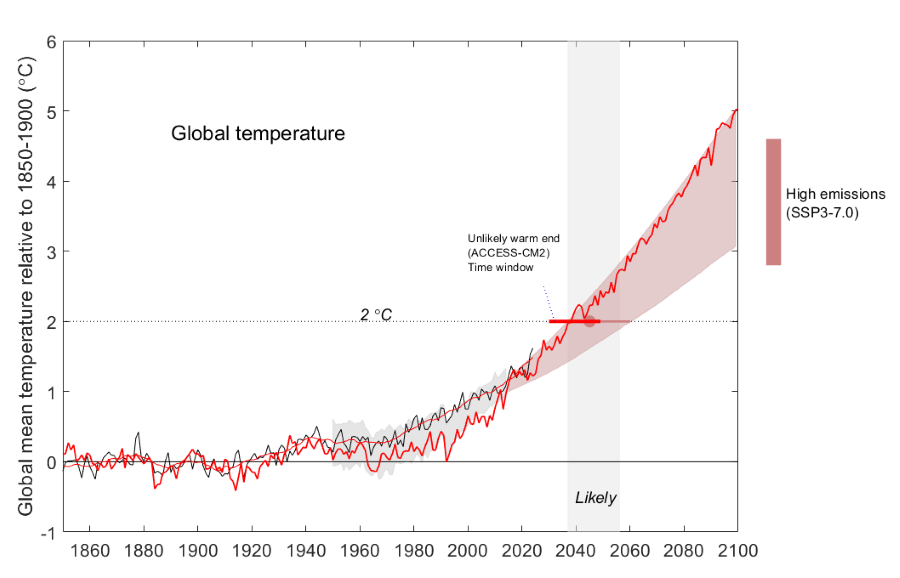
This graph shows the global mean surface temperature (GMSAT) for the period 1850–2100, relative to the 1850–1900 baseline – in observations (the black line), the assessed range of warming using all lines of evidence for the past (grey plume) and for SSP3-7.0 (pink plume), and the time window for likely reaching 2 °C (grey vertical band, 2037-2056). Overlaid on this is the simulation by Australia’s ACCESS-CM2 model (red line) – this a model with high warming through 21st Century, with the 20-year window used to ‘time sample’ the climate at 2 °C GWL (red bar) arriving at the earliest time assessed as likely under SSP3-7.0 (2030-2049).
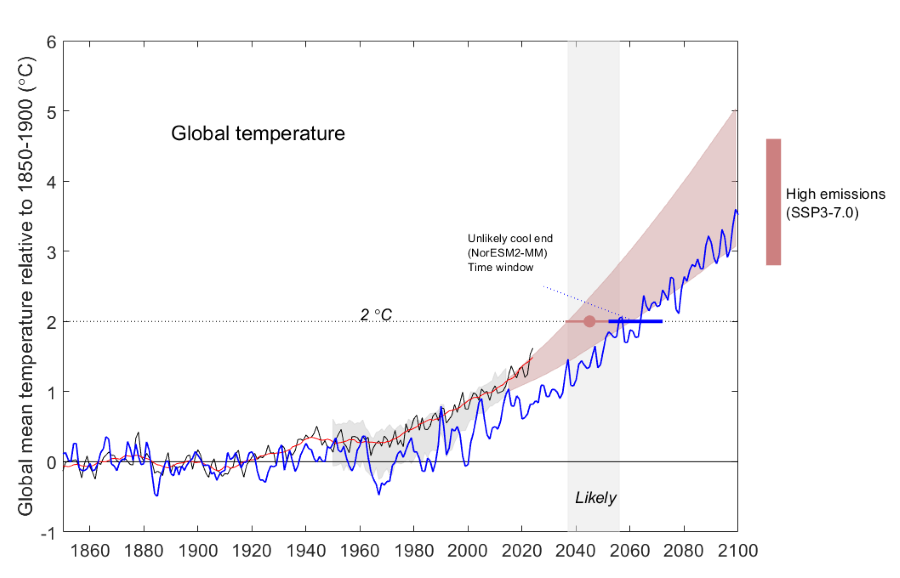
This graph shows the same as above but for a model with low warming (NorESM2-MM) that arrives at 2 °C the latest considered likely under SSP3-7.0 (2052-2071).
Page last updated 1st Dec 2025.