Climate Change in Australia
Climate information, projections, tools and data
Rainfall Change
Change in average rainfall at global warming levels
Note: Reaching a global warming level means the global surface air temperature (GSAT) is steadily at or near that level relative to the baseline (reference period) chosen to represent the pre-industrial climate: 1850–1900.
Average rainfall change is reported between the baseline period employed to benchmark global warming (1850-1900), and either a more recent ‘standard’ baseline of 1995-2014 (or recent Global Warming Level of 1.2 °C), to the future period when the world reaches the warming level (as indicated). Percentage change from the nine-model ensemble, identified as the ‘application-ready locally relevant dataset’, is presented here. We note these results are similar to those for the entire CMIP6 ensemble. Change in average rainfall is reported - not changes in rainfall extremes, which can be different from the change in the average.
Spatial Maps of projected change
The global average precipitation is projected to increase in a warmer world. But the likely change is very different in different parts of the world, from decrease, little change to increase. Changes are strongly related to the change in atmospheric circulation and weather patterns. There is also a range of plausible change currently assessed from various lines of evidence, and there is not a strong consensus between different climate models in most places - but several notable cases where there is strong agreement such as southwest Australia.
Global Spatial Patterns
The central estimate projection (multi model average, shown in % change) of annual rainfall change, from the 1850-1900 baseline aligning to the different Global Warming Levels (GWLs):

Rainfall increase in many equatorial and polar regions and rainfall decrease in many mid-latitude regions – consistent with our understanding of broad changes in the atmospheric circulation
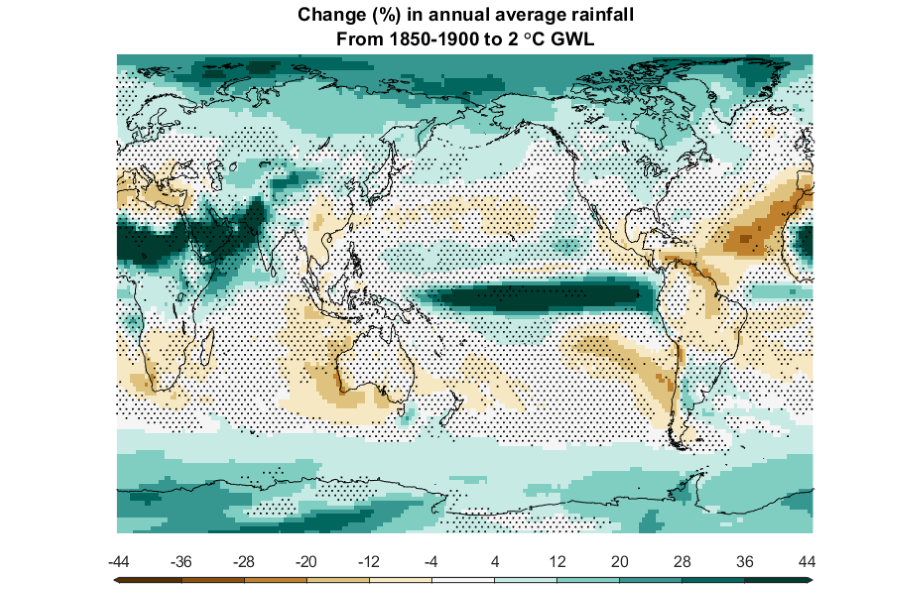

Pattern is similar but stronger at each higher GWL
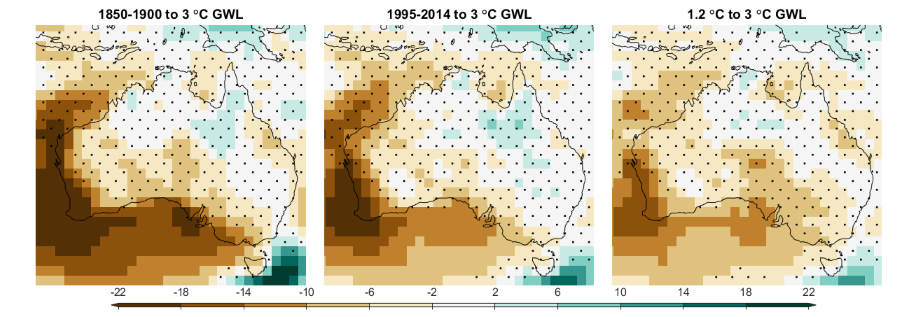
Australian Annual Rainfall
Focussing on Australia and narrowing the colour scale to better see the detail, annual average rainfall change from the 1850-1900 baseline to the future time when the world reaches each warming level, the central estimate projection is:

Rainfall decrease in the southwest at all warming levels, likely decrease in parts of the southeast, the change ‘signal’ is larger at each higher GWL
As for temperature, the projected future change is smaller when using the later baseline period (1995-2014), or the recent Global Warming Level (1.2 °C GWL) rather than the earlier baseline (1850-1900) used to benchmark global warming. This is because some rainfall change has already been experienced with the 1.2 °C warming since 1850-1900. The more recent baselines are more relevant to our recent lived experience.
Australian Seasonal Average Rainfall

A seasonal breakdown shows projected rainfall decrease in is strongest in Winter and Spring in Australia’s southwest and southeast strongest in Winter and Spring
Note: Northern and much of central Australia are seasonally dry in winter (JJA) and spring (SON), so % changes are relative to a small amount.
Page last updated 1st Dec 2025