Climate Change in Australia
Climate information, projections, tools and data
Greenhouse gas scenarios
The future of anthropogenic greenhouse gas and aerosol emissions (and hence their resultant radiative forcing) is highly uncertain, encompassing substantial unknowns in population and economic growth, technological developments and transfer, and political and social changes.
There have been numerous generations of internationally agreed scenario sets used by the IPCC over the last 30 years, all with some common features such as diverging pathways of development and therefore human effects on the climate:
- The IS92 from 1992
- The Special Report on Emissions Scenarios (SRES) from 2000
- The Representative Concentration Pathways (RCPs) from 2010
- The Shared Socio-economic Pathways (SSPs) from 2018
The are also useful scenarios from outside the climate science community, including those from the Network for the Greening of the Financial System and the International Energy Agency.
REPRESENTATIVE CONCENTRATION PATHWAYS - RCPS
Most of the Australian climate change projections found on this site are derived from climate model output from the Coupled Model Intercomparison Project phase 5 (CMIP5). This used data from the RCPs as input to climate projections.
The RCPs span a range of plausible global warming scenarios. They provide a range of options for the world’s governments and other institutions for decision making.

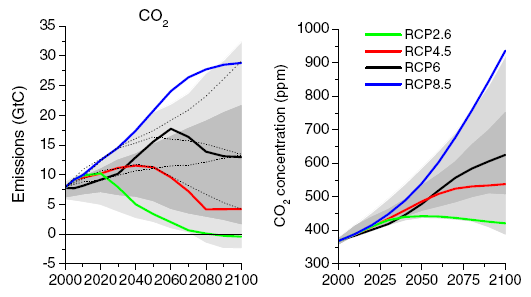
Emissions of CO₂ across the RCPs (left), and trends in concentrations of carbon dioxide (right). Grey area indicates the 98th and 90th percentiles (light/dark grey) of the values from the literature). The dotted lines indicate four of the SRES marker scenarios. SOURCE: van Vuuren et. al. (2011)

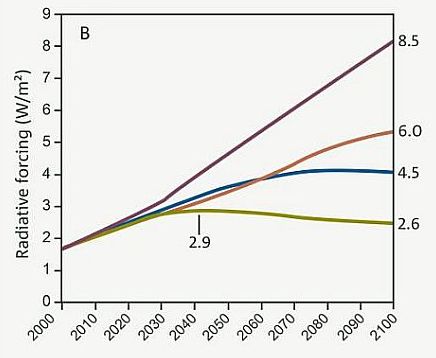
Radiative forcing for the different RCPs. The numbers on the right show the final radiative forcing at 2100 and give each scenario its name (8.5, 6.0, 4.5 and 2.6 W/m²) SOURCE: Climate Change in Australia Technical Report
RCPs are prescribed pathways for greenhouse gas and aerosol concentrations, together with land use change, that are consistent with a set of broad climate outcomes used by the climate modelling community. The pathways are characterised by the radiative forcing produced by the end of the 21st century. Radiative forcing is the extra heat the lower atmosphere will retain as a result of additional greenhouse gases, measured in Watts per square metre (W/m²).
The RCPs represent a wider set of futures that the previous emissions scenarios used by climate modelling community (SRES), and now explicitly include the effect of mitigation strategies. As with SRES, no particular scenario is deemed more likely than the others, however, some require major and rapid change to emissions to be achieved.
There are four RCPS
RCP8.5 - a future with little curbing of emissions, with a CO2 concentration continuing to rapidly rise, reaching 940 ppm by 2100.
RCP6.0 – lower emissions, achieved by application of some mitigation strategies and technologies. CO2 concentration rising less rapidly (than RCP8.5), but still reaching 660 ppm by 2100 and total radiative forcing stabilising shortly after 2100.
RCP4.5 - CO2 concentrations are slightly above those of RCP6.0 until after mid-century, but emissions peak earlier (around 2040), and the CO2 concentration reaches 540 ppm by 2100.
RCP2.6 - the most ambitious mitigation scenario, with emissions peaking early in the century (around 2020), then rapidly declining. Such a pathway would require early participation from all emitters, including developing countries, as well as the application of technologies for actively removing carbon dioxide from the atmosphere. The CO₂ concentration reaches 440 ppm by 2040 then slowly declines to 420 ppm by 2100).
Further information (external links):
The representative concentration pathways: an overview > Paper by van Vuuren et. al. 2011SHARED SOCIO-ECONOMIC PATHWAYS - SSPS
Some of the data available from this website is based on the latest generation of global climate modelling from the Coupled Model Intercomparison Project phase 6 (CMIP6). This used data from the SSPs as input to climate projections.
Like RCPs, these pathways span a range of plausible global warming scenarios and provide a range of options for the world’s governments and other institutions for decision making. There are various attributes of the pathways to understand:
- The socio-economic narrative behind each pathway, from SSP1 (Sustainability) to SSP5 (Fossil Fuelled Development)
- The additional greenhouse effect added (known as ‘radiative forcing’) at 2100, expressed in W/m2
- The concentrations of greenhouse gases leading to the extra greenhouse effect.
The emissions and other human influences associated with each SSP combination to produce the concentrations.
THERE ARE FOUR MAIN SSPS
SSP1-2.6 – a ‘Sustainability’ narrative under which there is an immediate reduction in emissions and a rapid transition to ‘net zero’. This SSP is likely to keep global warming to below 2 °C relative to pre-industrial time (the main goal of the Paris Agreement).
SSP2-4.5 – a ‘Middle of the Road’narrative under which emissions start to fall in the middle of the century. This is most similar to current global emissions reductions policies and pledges (assuming that they are met), leading to around 2.1 to 3.5 °C of global warming at 2100 relative to pre-industrial times.
SSP3-7.0 – a ‘Regional Rivalry’ narrative under which emissions continue to rise, to roughly double present levels by 2100. This is consistent with 2.8 to 4.6 °C of global warming at 2100 relative to pre-industrial times. It is often used as a ‘high emissions’ scenario since SSP5-8.5 (see below) is widely considered to have unrealistically high emissions.
SSP5-8.5 – a 'Fossil-fueled development’ narrative under which emissions rise rapidly to roughly double present levels by 2050, a rate now considered to be unrealistically high. This is consistent with warming of 3.3 to 5.7 °C at 2100 relative to pre-industrial times.
Further information (external links):
The shared socio-economic pathway (SSP) greenhouse gas concentrations and their extensions to 2500 > Scientific paper by Meinshausen et. al. 2020 Explainer: How ‘Shared Socioeconomic Pathways’ explore future climate change > Carbon Brief article by Zeke Hausfather 2018 Understanding SSPs > Fact Sheet by the NESP Climate Systems Hub 2024Global Warming Levels
The other main framework commonly used to present climate projections is the global warming level framework. Global warming level projections show how the climate of a region is expected to change by the time the globally averaged temperature reaches certain levels of warming (e.g., 1.5 °C, 2 °C, 3 °C) above the pre-industrial climate. Framing regional climate projections can help decision-makers understand the implications of the Paris Agreement, which aims to hold ‘the increase in the global average temperature to well below 2°C above pre-industrial levels’ and pursue efforts ‘to limit the temperature increase to 1.5°C above pre-industrial levels’. However, global warming level projections are not appropriate for some aspects of climate change, such as sea-level rise, where the trajectory of future global warming (and not just the absolute amount) is important. Also, they cannot be related to time horizons for future planning without additional projections of when global warming levels may be reached.
Page updated 19th May 2025


