Climate Change in Australia
Climate information, projections, tools and data
MODEL SUB-SETS FOR APPLICATION-READY DATA
CMIP5 Application-ready data
The national climate change projections for Australia released in 2015 were primarily based on Global Climate Model (GCMs) from the Coupled Model Intercomparison Project phase 5 (CMIP5). To facilitate efficient exploration of how the projections translate to climate change impacts, application-ready data are provided for eight of the 40 CMIP5 models.
Model selection
A number of steps were considered in the model selection process:
- Rejection of models that were found to have a low performance ranking across a number of metrics in Chapter 5 and in some other relevant assessments (see Chapter 9 of the Technical Report for a full description).
- Selection of models for which projection data were available for climate variables commonly used in impact assessments, for at least RCP4.5 and RCP8.5. Projections for other RCPs are included where possible.
- Amongst these, identification of models that are representative of the range of seasonal temperature and rainfall projections for a climate centred on 2050 and 2090 and RCP4.5 and RCP8.5 using the Australian Climate Futures software.
- Projections for wind were assessed separately from temperature and rainfall to ensure the CMIP5 range was captured. This is because the direction and magnitude of wind projections are not necessarily correlated with the temperature and/or rainfall projections.
- Availability of corresponding statistical or dynamical downscaled data.
- Consideration of the independence of the models (see Knutti 2013)
Selected CMIP5 models and reasons for their inclusion
| SELECTED MODELS | CLIMATE FUTURES | WIND | OTHER |
|---|---|---|---|
| ACCESS1.0 | Maximum consensus for many regions. | The model exhibited a high skill score with regard to historical climate. | |
| CESM1-CAM5 | Hotter and wetter, or hotter and least drying | This model was representative of a low change in an index of the Southern Annular Mode (per degree global warming). Further, the model has results representing all RCPs. | |
| CNRM-CM5 | Hot /wet end of range in Southern Australia | This model was representative of low warming/dry SST modes as described in Watterson (2012) (see Section 3.6). It also has a good representation of extreme El Niño in CMIP5 evaluations (see Cai et al., 2014). | |
| GFDL-ESM2M | Hotter and drier model for many clusters | Greatest increase | This model was representative of the hot/dry SST mode as described in Watterson (2012) (see Section 3.6). It also has a good representation of extreme El Niño in CMIP5 evaluations (see Cai et al., 2014). Further, the model has results representing all RCPs. |
| HadGEM2-CC | Maximum consensus for many regions. | Greatest reduction | This model has good representation of extreme El Niño in CMIP5 evaluations (see Cai et al., 2014) |
| CanESM2 | This model was representative of the hot/wet SST mode as described in Watterson (2012) (Section 3.6). It also has a high skill score with regard to historical climate and it increased representation of the spread in genealogy of models (Knutti et al., 2013). It also has good representation of extreme El Niño in CMIP5 evaluations (Cai et al., 2014). | ||
| MIROC5 | Low warming wetter model | This model was representative of a higher change in an index of the Southern Annular mode (per degree global warming). It also has good representation of extreme El Niño in CMIP5 evaluations (see Cai et al., 2014). Further, the model has results representing all RCPs. | |
| NorESM1-M | Low warming wettest representative model | No wind data | This model was representative of the low warming/wet SST mode as described in Watterson (2012) (see Section 3.6). The model also has results representing all RCPs. |
This table can be found in Box 9.2 of the Technical Report
Model Details
| MODEL | INSTITUTE | OCEAN RESOLUTION (°) | ATMOSPHERE RESOLUTION (°) [km at Equator] |
|---|---|---|---|
| ACCESS1.0 | CSIRO-BOM, Australia | 1.0×1.0 | 1.9×1.2 [210×130] |
| CanESM2 | CCCMA, Canada | 1.4×0.9 | 2.8×2.8 [310×310] |
| CESM1-CAM5 | NSF-DOE-NCAR, USA | 1.1×0.6 | 1.2×0. [130×100] |
| CNRM-CM5 | CNRM-CERFACS, France | 1.0×0.8 | 1.4×1.4 [155×155] |
| GFDL-ESM2M | NOAA, GFDL, USA | 1.0×1.0 | 2.5×2.0 [275×220] |
| HadGEM2-CC | MOHC, UK | 1.0×1.0 | 1.9×1.2 [210×130] |
| MIROC5 (for non-commercial use only) | JAMSTEC, Japan | 1.6×1.4 | 1.4×1.4 [155×155] |
| NorESM1-M | NCC, Norway | 1.1×0.6 | 2.5×1.9 [275×210] |
This information is extracted from Table 3.3.1 of the Technical Report
How well does the eight-model subset represent the range of projected changes from all models?
The bar plots in the expandable sections below, show where each model from the eight-model subset sits in relation to the range from all available models. For this analysis, average changes in temperature and rainfall over the four Super-Clusters were considered.
The plots show that the eight-model subset does a good job of representing the range in most cases. However, any form of sub-setting involves compromises and there are some situations where the subset under-represents the full range. In general, representation is better for temperature than rainfall, with the subset occasionally under-representing the cooler part of the range (e.g. 2050s Southern Australia, summer under RCP8.5). For rainfall, the subset sometimes under-represents the wetter part of the range (e.g. 2090s Eastern Australia, autumn under RCP4.5) and sometimes under-represents the drier part of the range (e.g. 2050s Northern Australia, spring under RCP4.5)
Mid Century (2050s)
 projected temperature change in °C (left), rainfall relative percent change (right) for, from top to bottom, Northern Australia, Rangelands, Eastern Australia, and Southern Australia Super-Clusters. Data for annual, summer (DJF), autumn (MAM), winter (JJA) and spring (SON) are plotted from left to right in each graph. Bar ranges indicate 10th to 90th percentile of 20-year running mean of 40 CMIP5 models.")
Mid century (2050) projected temperature change in °C (left), rainfall relative percent change (right) for, from top to bottom, Northern Australia, Rangelands, Eastern Australia, and Southern Australia Super-Clusters. Data for annual, summer (DJF), autumn (MAM), winter (JJA) and spring (SON) are plotted from left to right in each graph. Bar ranges indicate 10th to 90th percentile of 20-year running mean of 40 CMIP5 models.
Late Century (2090s)
 projected temperature change in °C (left), rainfall relative percent change (right) for, from top to bottom, Northern Australia, Rangelands, Eastern Australia, and Southern Australia Super-Clusters. Data for annual, summer (DJF), autumn (MAM), winter (JJA) and spring (SON) are plotted from left to right in each graph. Bar ranges indicate 10th to 90th percentile of 20-year running mean of 40 CMIP5 models.")
Late century (2090) projected temperature change in °C (left), rainfall relative percent change (right) for, from top to bottom, Northern Australia, Rangelands, Eastern Australia, and Southern Australia Super-Clusters. Data for annual, summer (DJF), autumn (MAM), winter (JJA) and spring (SON) are plotted from left to right in each graph. Bar ranges indicate 10th to 90th percentile of 20-year running mean of 40 CMIP5 models.
CMIP6 APPLICATION-READY DATA
Since national climate change projections for Australia were released in 2015, data from a new generation of GCMs has been made available from the Coupled Model Intercomparison Project phase 6 (CMIP6). To facilitate efficient exploration of how results from the ~50 CMIP6 models translates to climate change impacts for Australia, application-ready data are provided for nine of the CMIP6 models.
Model selection
Choosing global models consistent with those being used in national downscaling projections currently being developed has been prioritised. The models selected are the eight models selected for dynamical downscaling over Australia by the Australian Climate Service, plus an additional high-warming model being downscaled by NSW Government’s NARCliM2.0 project (as a low probability, high-impact case). They perform relatively well at simulating the climate of the Indo-Pacific region as well as relevant aspects of the climate drivers and processes. The models were also selected to span the CMIP6 range of changes in annual and seasonal mean temperature and rainfall over Australia and contain representative spread of changes in important drivers such as the change in the subtropical ridge of high pressure over Australia (Grose et al 2023).
A number of steps were considered in the model selection process (see Grose et al 2023 for details):
- Selection of models for which data required for dynamical downscaling was published (not all modelling groups published the sub-daily data for all CMIP6 models that many downscaling models require). Note that this is not a requirement for the generation of application-ready data, but application ready-data has currently only been generated for models that have been selected for downscaling. This is the main difference in the process compared to the selection of models for the CMIP5 application-ready data and it slightly limits the models that can be drawn from.
- Rejection of models with low performance across a range of indicators. Performance was first assessed in terms of the simulation of observed characteristics of the climate of the Indo-Pacific and Australian regions and in terms of the simulation of atmospheric circulation and the influence of major climate drivers, such as the El Niño Southern Oscillation, on the Australian climate. Low performance in other relevant assessments published in scientific literature was then considered.
- Selection of a subset of models that did not include models that were closely related to each other. This avoids overconfidence in results simulated by multiple models that share common approaches, and even computer code.
- Selection of a subset of models that reflects our estimates of climate sensitivity, how a measure of how much the global average temperature increases in response to a doubling of the concentration of carbon dioxide in the atmosphere. This step is necessary because it is has been shown that a disproportionate number of the CMIP6 models have high values of climate sensitivity and simulate very high rates of global warming in response to increases in atmospheric carbon dioxide concentrations.
- Selection of a subset of models that samples the main categories of projected changes in temperature and rainfall simulated by the full set of CMIP6 models for eight broad climatic regions of Australia, including slow warming, rapid warming, drying and wetting. This was done by examining simulated changes in annual mean temperature and rainfall between 1950–1999 and 2050–2099 under SSP3-7.0, as being representative of a strong climate change signal.
Selected CMIP6 models and reasons for their inclusion
This table is adapted from Table 3 of Grose el al (2023). It describes future changes in temperature and rainfall projected by the nine selected CMIP6 models. Note that the MPI-ESM1-2-HR model was not selected by Grose el al (2023) but was subsequently selected following further information concerning the availability of data required for downscaling.
| SELECTED MODELS | RESOLUTION (km) | DESCRIPTION |
|---|---|---|
| ACCESS-CM2 | 140 | A much hotter future, and drier in most regions except the southeast |
| ACCESS-ESM1.5 | 140 | A hotter and much drier future |
| CESM2 | 100 | A hotter future, wetter in parts of the east and north |
| CMCC-ESM2 | 100 | A much warmer future with little change in mean rainfall (with regional exceptions) |
| CNRM-ESM2-1 | 140 | A much hotter future, much drier especially in the east, but wetter in the northwest |
| EC-Earth3 | 80 | A hotter future, with much wetter and more variable rainfall for much of Australia (except southwest Western Australia) |
| MPI-ESM1-2-HR | 80 | Lower warming, mid-range changes in rainfall |
| NorESM2-MM | 100 | Lower warming, mid-range changes in rainfall |
| UK-ESM1-0-LL | 140 | Extremely high warming (a low probability, high impact case) |
Resolution is the approximate size of model grid cells in the atmosphere sourced from Table A11.5 of Annex II in Climate Change 2021: The Physical Science Basis. Contribution of Working Group I to the Sixth Assessment Report of the Intergovernmental Panel on Climate Change.
A suitable set of representative models will be different depending on whether the Shared Socioeconomic Pathway (SSP) and time horizon framework is being used, or the Global Warming Levels (GWLs) framework – see Global Warming Levels .
For SSPs and time horizons, the warmest projections for Australia are also the warmest globally – the two are loosely corelated. Therefore, it is important to appropriately sample the ‘hot models’ (warmest projection, e.g. ACCESS-CM2), the mid-range, and those at the coolest plausible end (e.g., NorESM2-MM), see below.
When using the GWL framework, the projections are standardised for global warming – they present regional climate information for the condition when a global warming level is met. A particular warming level will be met sooner in a ‘hot model’ and later in a model at the cooler end. Therefore, a representative set of models will reflect the range of model results in regional warming compared to the global average – from regional enhancement to regional suppression, labelled ‘Regionally Warmer’ to ‘Regionally Cooler’ below. Using the GWL framework, a ‘hot model’ (one which warms faster under a given emissions scenario) will not necessarily represent the hot end of warming for Australia under a given GWL. At least some of this regional warming ratio is related to rainfall change- e.g., the model with the wettest projection, EC-Earth3, is Regionally Cooler.
The order of models, in terms of change in mean annual rainfall is not so different between the two projections frameworks.
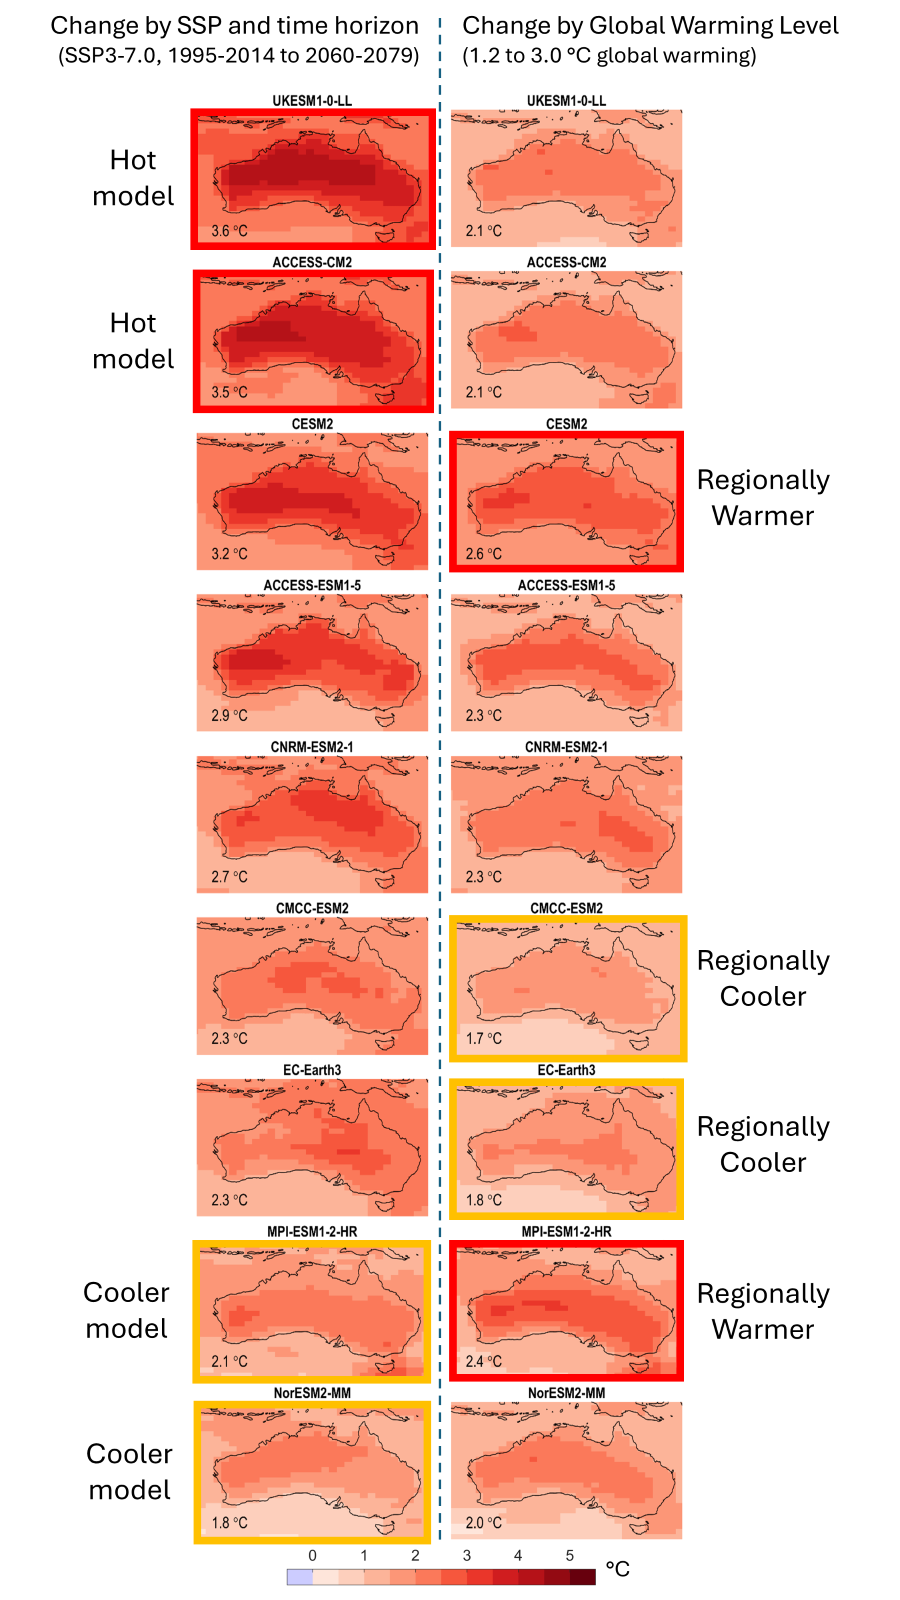
The projected warming over Australia in the nine model CMIP6 sub-set available as application-ready locally relevant dataset for an example SSP and time horizon (left column) and for an example GWL (right column). The models are ordered by the warming in the SSP, and the change in that order in the right column is visible.
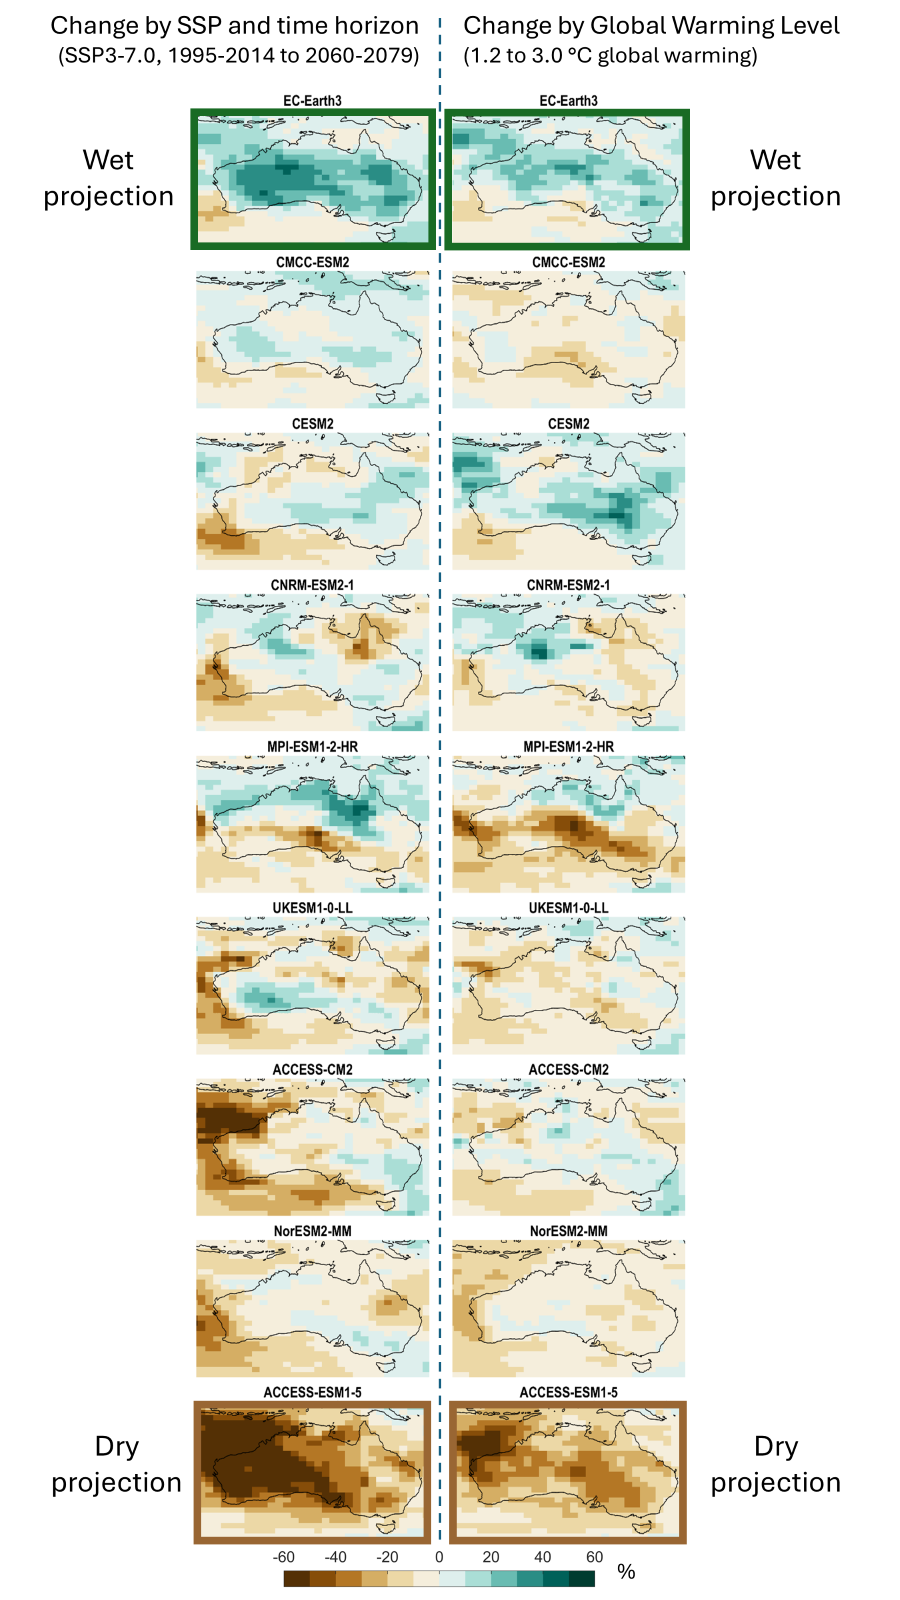
As above but for mean annual rainfall, showing some differences in the signal between the two cases, but with many commonalities (e.g., the wet-end projection EC-Earth3 and dry-end ACCESS-ESM1.5 are consistent in both)
Page last updated 1st Dec 2025