Climate Change in Australia
Climate information, projections, tools and data
CMIP6 – description and comparison to CMIP5
Global climate models are an important part of the toolbox for examining future climate change. The use of the models for this purpose is facilitated by the Coupled Model Intercomparison Project (CMIP), an international collaboration that brings together global climate modelling from institutes around the world. CMIP has grown to be a vital resource for climate research but also for making projections of the future climate for decisionmakers. The CMIP effort spans several decades, from early more informal science collaborations through to the latest iteration, the Coupled Model Intercomparison Project phase 6 (CMIP6).
The CMIP6 ensemble of model simulations was produced in 2015-2021 and was a key input to the Intergovernmental Panel on Climate Change (IPCC) Sixth Assessment Report. It involves many models contributed from numerous countries around the world.
The CMIP6 simulations relevant to climate projections are the ‘Historical’ simulations and the ‘ScenarioMIP’ simulations. The Historical simulations cover the 1850-2014 period and use observed greenhouse gas concentrations and other forcings. The ScenarioMIP simulations include simulations of the 21st Century for the Shared Socioeconomic Pathways (SSPs), which provide trajectories of future global emissions of greenhouse gases to explore future change. This is a difference from the previous, CMIP5, phase of CMIP, which used Representative Concentration Pathways (RCPs). We have access to up to 50 CMIP6 models for the Historical period, with at least 33 models available for the four most commonly used (‘Tier 1’) SSPs (some individual SSPs have more). The future emissions trajectories for the Tier 1 SSPs range from SSP1-2.6, consistent with a future in which we broadly meet the goals of the Paris Agreement, to SSP5-8.5, reflecting a scenario with extremely high future emissions.
Australia contributed output from two versions of the Australian Climate Community Earth Systems Simulator (ACCESS) to CMIP6: ACCESS Coupled Model version 2 (ACCESS-CM2) and the ACCESS Earth System Model version 1.5 (ACCESS-ESM1.5).
The IPCC Sixth Assessment found that CMIP6 shows several incremental improvements and enhancements over CMIP5, but many of the same features and limitations remain. Projected changes in future climate are broadly similar between CMIP5 and CMIP6, and any differences can be described as incremental – coming from differences in the scenarios used (RCPs versus SSPs), different number and families of models contributing, as well as developments in the models themselves (e.g. slight changes in how they represent the physics and chemistry of the atmosphere). There are no dramatic new projected changes that contradict CMIP5 results.
Projections results for broad regions of the world in CMIP6 as well as other model sets can be explored in:
- The IPCC Interactive Atlas (see screenshot below)
- The Copernicus Interactive Climate Atlas
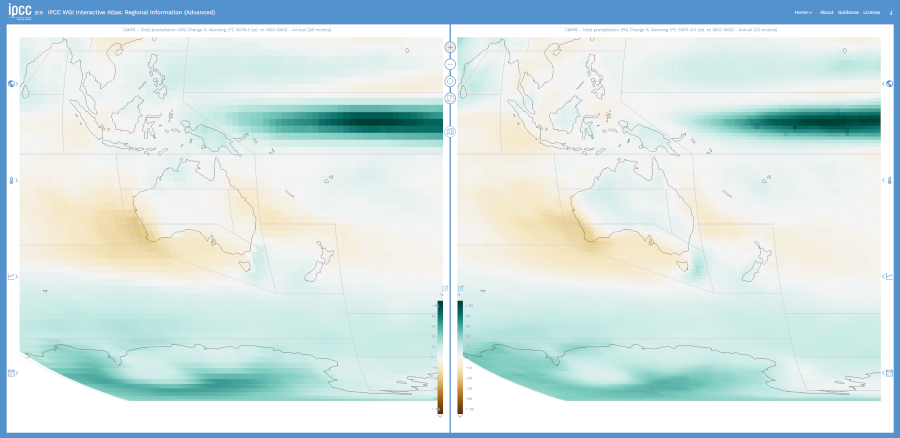
Screenshot of the IPCC Interactive Atlas showing the multi-model mean projected change in average annual rainfall at 2 °C global warming, left CMIP6 and right CMIP5.
For Australia specifically, an assessment of the CMIP6 models indicated several incremental improvements over CMIP5 in Australian climate statistics and relevant climate processes. The assessment shows that CMIP6 has broadly similar projections as CMIP5 for a high scenario, with one exception – the major new issue of the overrepresentation of hot models, which is relevant to Australia as well as globally.
The ‘hot model’ issue
One major new issue in CMIP6 compared to CMIP5 is that there is a greater proportion of models producing high warming – warming that is considered possible but unlikely by recent assessments of a wide range of evidence (e.g., Sherwood et al. 2020). This needs to be accounted for when producing projections.
There is a wider spread of a key feature called ‘Climate Sensitivity’ within the ensemble of CMIP6 models. Climate Sensitivity refers to the amount of global warming occurring for a doubling of carbon dioxide in the atmosphere. Higher climate sensitivity meaning higher warming in response to increased greenhouse gas levels. The CMIP6 ensemble has a larger group of ‘hot models’ with high climate sensitivity than CMIP5. High warming values from these models with high climate sensitivity can’t be ruled out but are over-represented in the spread of models (see figure below).
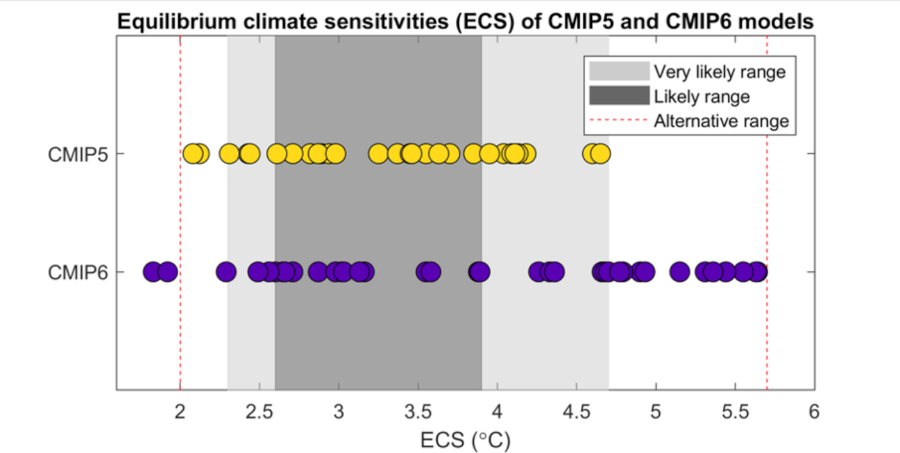
The spread of Equilibrium Climate Sensitivity (ECS) in the CMIP5 and CMIP6 generation of models (yellow and purple circles) compared to very likely and likely ranges assessed from the full range of evidence by Sherwood et al. (2020) (light grey and dark grey shading). The ‘Alternative range’ (red dotted lines) is the widest possible range that can’t be fully ruled out.
The overrepresentation of high climate sensitivity models in the CMIP6 ensemble presents a challenge for generating climate projections. It can be addressed in one of several ways, such as:
- Projections for Global Warming Levels (GWLs) can be used, which standardise for the rate of global warming.
- A weighting scheme can be applied, as done for the assessed global warming in the IPCC Sixth Assessment Report.
- Results from the ‘hot models’ can be presented separately as a ‘low likelihood high warming’ future rather than simply as part of the likely range.
For more information about this issue, see the briefing note produced by the ARC Centre of Excellence for Climate Extremes and the National Environmental Science Programme Earth Systems and Climate Change Hub.
Projections data based on CMIP6
Australian Climate Service 'application-ready' future climate data based on CMIP6 GCMs are now available for Australia from this website .
Page last updated: 19th May 2025